

The dependence of auditory nerve rate adaptation on electric stimulus parameters, electrode position, and fiber diameter: a computer model study
- PMID: 20033248
- PMCID: PMC2862915
- DOI: 10.1007/s10162-009-0199-2
The dependence of auditory nerve rate adaptation on electric stimulus parameters, electrode position, and fiber diameter: a computer model study
Abstract
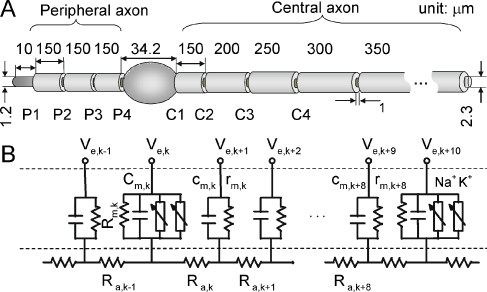
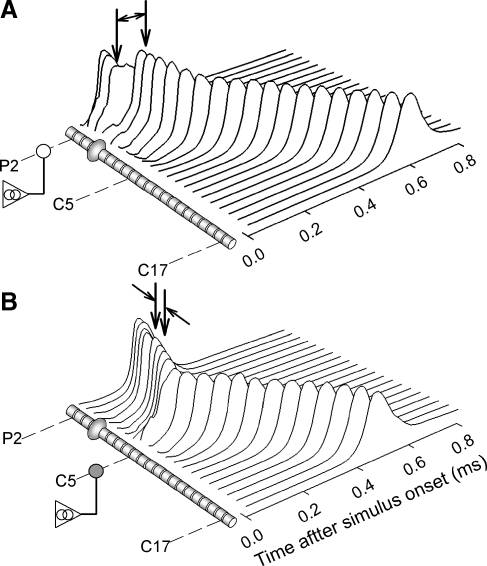
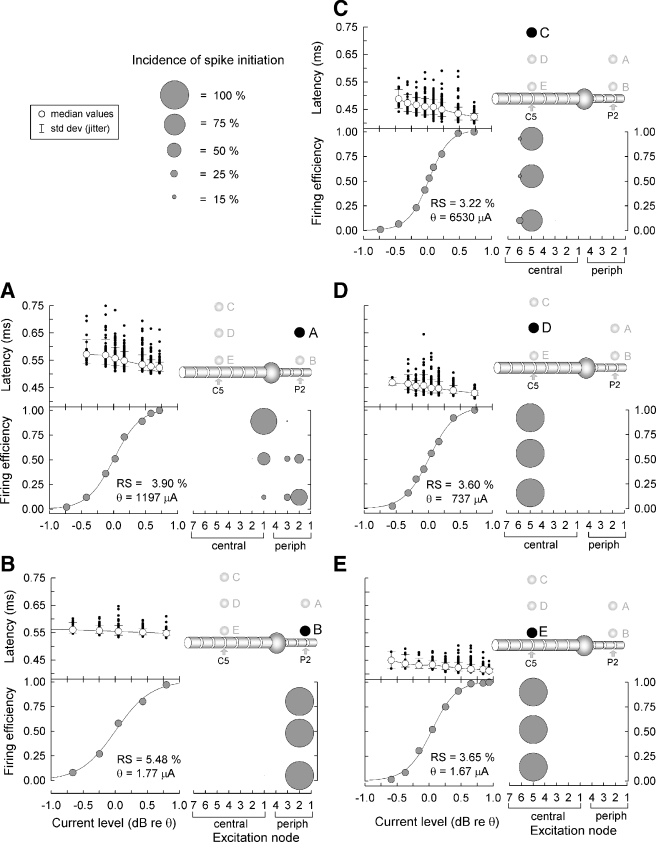
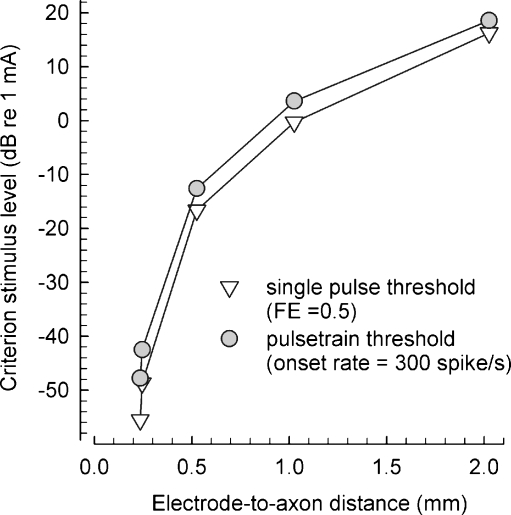
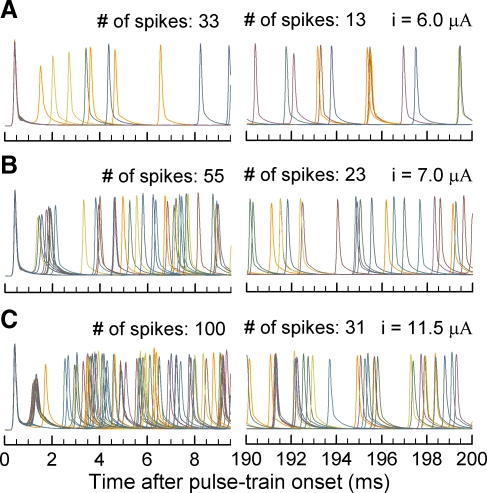
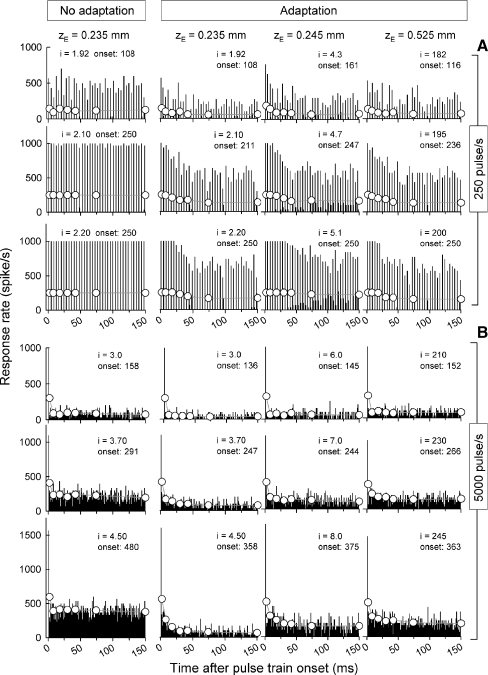
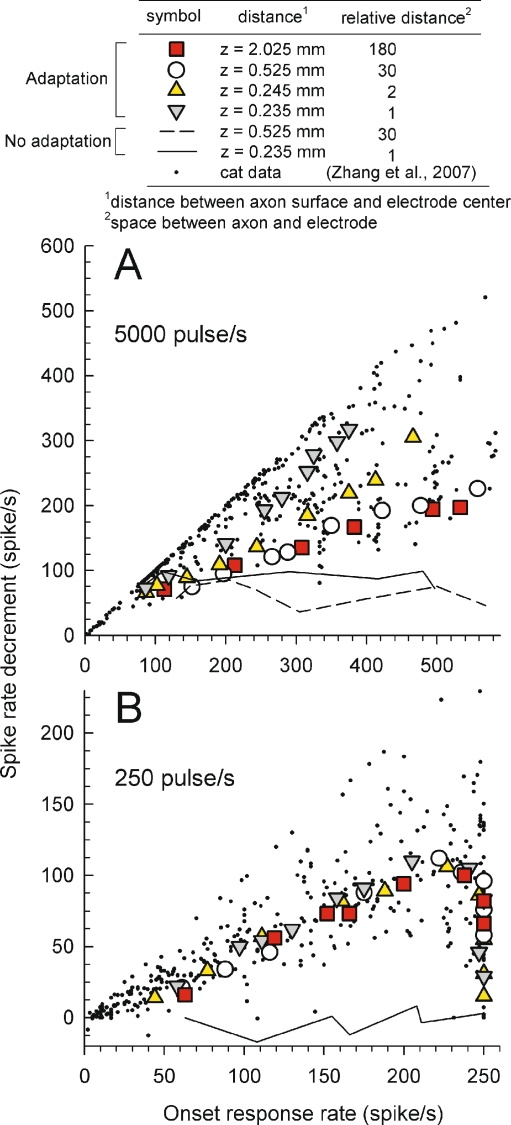
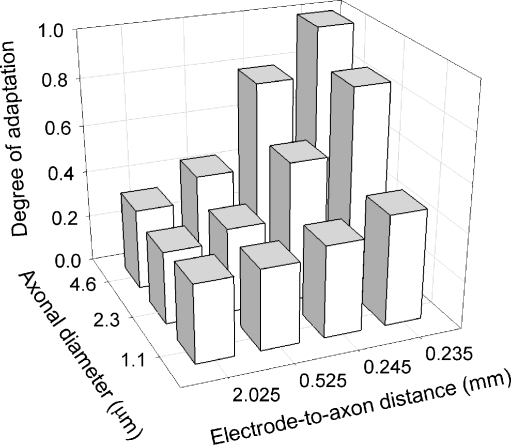
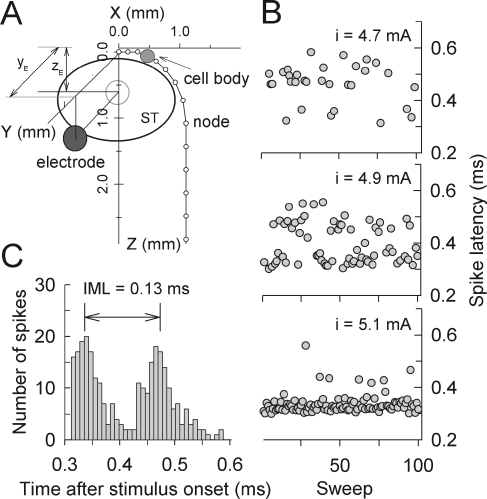
This paper describes results from a stochastic computational neuron model that simulates the effects of rate adaptation on the responses to electrical stimulation in the form of pulse trains. We recently reported results from a single-node computational model that included a novel element that tracks external potassium ion concentration so as to modify membrane voltage and cause adaptation-like responses. Here, we report on an improved version of the model that incorporates the anatomical components of a complete feline auditory nerve fiber (ANF) so that conduction velocity and effects of manipulating the site of excitation can be evaluated. Model results demonstrate rate adaptation and changes in spike amplitude similar to those reported for feline ANFs. Changing the site of excitation from a central to a peripheral axonal site resulted in plausible changes in latency and relative spread (i.e., dynamic range). Also, increasing the distance between a modeled ANF and a stimulus electrode tended to decrease the degree of rate adaptation observed in pulse-train responses. This effect was clearly observed for high-rate (5,000 pulse/s) trains but not low-rate (250 pulse/s) trains. Finally, for relatively short electrode-to-ANF distances, increases in modeled ANF diameter increased the degree of rate adaptation. These results are compared against available feline ANF data, and possible effects of individual parameters are discussed.
Figures
Similar articles
-
Effects of electrode position on spatiotemporal auditory nerve fiber responses: a 3D computational model study.Comput Math Methods Med. 2015;2015:934382. doi: 10.1155/2015/934382. Epub 2015 Feb 10. Comput Math Methods Med. 2015. PMID: 25755675 Free PMC article.
-
Changes in auditory nerve responses across the duration of sinusoidally amplitude-modulated electric pulse-train stimuli.J Assoc Res Otolaryngol. 2010 Dec;11(4):641-56. doi: 10.1007/s10162-010-0225-4. Epub 2010 Jul 15. J Assoc Res Otolaryngol. 2010. PMID: 20632064 Free PMC article.
-
Simulation of the electrically stimulated cochlear neuron: modeling adaptation to trains of electric pulses.IEEE Trans Biomed Eng. 2009 May;56(5):1348-59. doi: 10.1109/TBME.2008.2005782. IEEE Trans Biomed Eng. 2009. PMID: 19473930
-
Changes across time in spike rate and spike amplitude of auditory nerve fibers stimulated by electric pulse trains.J Assoc Res Otolaryngol. 2007 Sep;8(3):356-72. doi: 10.1007/s10162-007-0086-7. Epub 2007 Jun 12. J Assoc Res Otolaryngol. 2007. PMID: 17562109 Free PMC article.
-
Phenomenological modelling of electrically stimulated auditory nerve fibers: A review.Network. 2016;27(2-3):157-185. doi: 10.1080/0954898X.2016.1219412. Epub 2016 Aug 29. Network. 2016. PMID: 27573993 Review.
Cited by
-
Comparison of response properties of the electrically stimulated auditory nerve reported in human listeners and in animal models.Hear Res. 2022 Dec;426:108643. doi: 10.1016/j.heares.2022.108643. Epub 2022 Oct 28. Hear Res. 2022. PMID: 36343534 Free PMC article. Review.
-
Effects of electrode position on spatiotemporal auditory nerve fiber responses: a 3D computational model study.Comput Math Methods Med. 2015;2015:934382. doi: 10.1155/2015/934382. Epub 2015 Feb 10. Comput Math Methods Med. 2015. PMID: 25755675 Free PMC article.
-
Noise Masking in Cochlear Synaptopathy: Auditory Brainstem Response vs. Auditory Nerve Response in Mouse.J Neurophysiol. 2022 May 18;127(6):1574-85. doi: 10.1152/jn.00402.2021. Online ahead of print. J Neurophysiol. 2022. PMID: 35583974 Free PMC article.
-
A Phenomenological Model of the Electrically Stimulated Auditory Nerve Fiber: Temporal and Biphasic Response Properties.Front Comput Neurosci. 2016 Feb 8;10:8. doi: 10.3389/fncom.2016.00008. eCollection 2016. Front Comput Neurosci. 2016. PMID: 26903850 Free PMC article.
-
Monopolar Detection Thresholds Predict Spatial Selectivity of Neural Excitation in Cochlear Implants: Implications for Speech Recognition.PLoS One. 2016 Oct 31;11(10):e0165476. doi: 10.1371/journal.pone.0165476. eCollection 2016. PLoS One. 2016. PMID: 27798658 Free PMC article.
References
-
- Bruce I, Negm M (2009) IKLT and Ih may explain rapid and short-term spike rate adaptation in auditory nerve fiber responses to cochlear implant stimulation. Assoc Res Otolaryngol, Baltimore, MA, Abstract: 965
Publication types
MeSH terms
Substances
Grants and funding
LinkOut - more resources
Full Text Sources
