

Evaluation of different tests based on observations for external model evaluation of population analyses
- PMID: 20033477
- PMCID: PMC2874574
- DOI: 10.1007/s10928-009-9143-7
Evaluation of different tests based on observations for external model evaluation of population analyses
Abstract
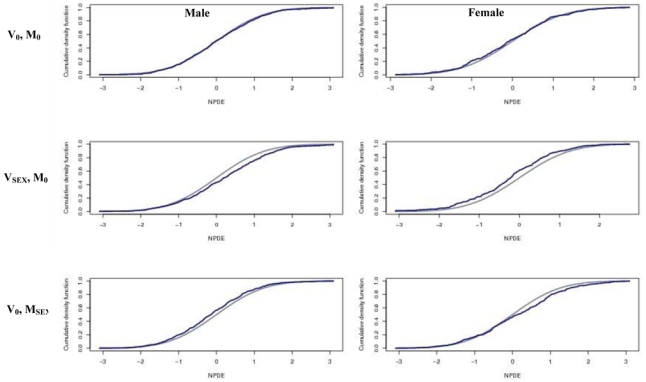
To evaluate by simulation the statistical properties of normalized prediction distribution errors (NPDE), prediction discrepancies (pd), standardized prediction errors (SPE), numerical predictive check (NPC) and decorrelated NPC (NPC(dec)) for the external evaluation of a population pharmacokinetic analysis, and to illustrate the use of NPDE for the evaluation of covariate models. We assume that a model M(B) has been built using a building dataset B, and that a separate validation dataset, V is available. Our null hypothesis H(0) is that the data in V can be described by M(B). We use several methods to test this hypothesis: NPDE, pd, SPE, NPC and NPC(dec). First, we evaluated by simulation the type I error under H(0) of different tests applied to the four methods. We also propose and evaluate a single global test combining normality, mean and variance tests applied to NPDE, pd and SPE. We perform tests on NPC and NPC(dec), after a decorrelation. M(B) was a one compartment model with first order absorption (without covariate), previously developed from two phase II and one phase III studies of the antidiabetic drug, gliclazide. We simulated 500 external datasets according to the design of a phase III study. Second, we investigated the application of NPDE to covariate models. We propose two approaches: the first approach uses correlation tests or mean comparisons to test the relationship between NPDE and covariates; the second evaluates NPDE split by category for discrete covariates or quantiles for continuous covariates. We generated several validation datasets under H(0) and under alternative assumptions with a model without covariate, with one continuous covariate (weight), or one categorical covariate (sex). We calculated the powers of the different tests using simulations, where the covariates of the phase III study were used. The simulations under H(0) show a high type I error for the different tests applied to SPE and an increased type I error for pd. The different tests present a type I error close to 5% for the global test appied to NPDE. We find a type I error higher than 5% for the test applied to classical NPC but this test becomes close to 5% for NPC(dec). For covariate models, when model and validation dataset are consistent, type I error of the tests are close to 5% for both effects. When validation datasets and models are not consistent, the tests detect the correlation between NPDE and the covariate. We recommend to use NPDE over SPE for external model evaluation, since they do not depend on an approximation of the model and have good statistical properties. NPDE represent a better approach than NPC, since in order to perform tests on NPC, a decorrelation step must be applied before. NPDE, in this illustration, is also a good tool to evaluate model with or without covariates.
Figures
References
-
- Powell JR, Gobburu JV. Pharmacometrics at FDA: evolution and impact on decisions. Clin Pharmacol Ther. 2007;82(1):97–102. Epub 2007 May 30. - PubMed
-
- Karlsson MO, Holford NH. A tutorial on visual predictive checks. 2008. p. 17. Abstr 1434 [ www.page-meeting.org/?abstract=1434]
Publication types
MeSH terms
Substances
LinkOut - more resources
Full Text Sources
Research Materials
Miscellaneous
