

Multispectral image analysis of binary encoded microspheres for highly multiplexed suspension arrays
- PMID: 20034006
- PMCID: PMC2891566
- DOI: 10.1002/cyto.a.20841
Multispectral image analysis of binary encoded microspheres for highly multiplexed suspension arrays
Abstract
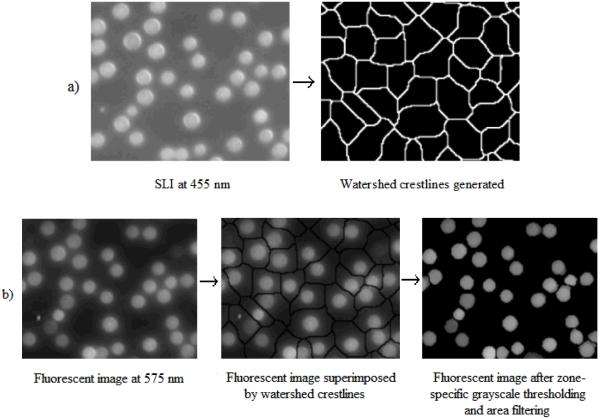
To push the 100-plex envelope of suspension array technology, we have developed fully automated methods to acquire multispectral images of multiplexed quantum-dot (QD) encoded microspheres, to segment them in the images, to classify them based on their color code, and to quantify the multiplexed assays. Instead of coding microspheres with two colors and n levels, microspheres were coded with n colors and two levels (present or absent), thus transforming the classification problem from analog to digital. Images of multiplexed microspheres, sedimented at the bottom of microwells, were acquired through a tunable filter at the peak luminescence wavelength of each QD coding species in the system and the assay label wavelength. Another image of the light scattered from microspheres was captured in the excitation bandwidth that was utilized to localize microspheres in multispectral luminescence images. Objects in the acquired images are segmented and luminescence from each identified microsphere in each channel is recorded, based on which the "color code" of each microsphere is determined by applying a mathematical model and a classification algorithm. Our image analysis procedures could identify and classify microspheres with more than 97% accuracy, and the assay CVs were under 20%. These proof-of-principle results demonstrate that highly multiplexed quantification of specific proteins is possible with this rapid, small-sample volume format.
Keywords: image analysis; imaging cytometry; imaging-based systems; microscopy; microsphere-based arrays; multiplexed assays; quantum dots; suspension arrays.
Figures
Similar articles
-
Suspension arrays based on nanoparticle-encoded microspheres for high-throughput multiplexed detection.Chem Soc Rev. 2015 Aug 7;44(15):5552-95. doi: 10.1039/c4cs00382a. Epub 2015 May 29. Chem Soc Rev. 2015. PMID: 26021602 Free PMC article. Review.
-
Investigation and development of quantum dot-encoded microsphere bioconjugates for DNA detection by flow cytometry.J Fluoresc. 2012 Mar;22(2):685-97. doi: 10.1007/s10895-011-1004-2. Epub 2011 Nov 5. J Fluoresc. 2012. PMID: 22057294
-
An open-source software analysis package for Microspheres with Ratiometric Barcode Lanthanide Encoding (MRBLEs).PLoS One. 2019 Mar 22;14(3):e0203725. doi: 10.1371/journal.pone.0203725. eCollection 2019. PLoS One. 2019. PMID: 30901328 Free PMC article.
-
CdSe/ZnS quantum dot-encoded maleic anhydride-grafted PLA microspheres prepared through membrane emulsification for multiplexed immunoassays of tumor markers.Analyst. 2022 May 3;147(9):1873-1880. doi: 10.1039/d2an00350c. Analyst. 2022. PMID: 35420086
-
Microparticle encoding technologies for high-throughput multiplexed suspension assays.Integr Biol (Camb). 2009 Jun;1(5-6):345-62. doi: 10.1039/b905502a. Epub 2009 May 7. Integr Biol (Camb). 2009. PMID: 20023742 Free PMC article. Review.
Cited by
-
Correlated matrix-assisted laser desorption/ionization mass spectrometry and fluorescent imaging of photocleavable peptide-coded random bead-arrays.Rapid Commun Mass Spectrom. 2014 Jan 15;28(1):49-62. doi: 10.1002/rcm.6754. Rapid Commun Mass Spectrom. 2014. PMID: 24285390 Free PMC article.
-
Suspension arrays based on nanoparticle-encoded microspheres for high-throughput multiplexed detection.Chem Soc Rev. 2015 Aug 7;44(15):5552-95. doi: 10.1039/c4cs00382a. Epub 2015 May 29. Chem Soc Rev. 2015. PMID: 26021602 Free PMC article. Review.
References
-
- MacBeath G. Protein microarrays and proteomics. Nature Genetics. 2002;32(Suppl 2):526–532. - PubMed
-
- MacBeath G, Schreiber SL. Printing proteins as microarrays for high throughput function determination. Science. 2000;289(5485):1760–1763. - PubMed
-
- Templin MF, Stoll D, Schrenk M, Traub PC, Vohringer CF, Joos TO. Protein microarray technology. Trends in Biotechnology. 2002;20(4):160–166. - PubMed
-
- Meza MB. Bead-based HTS applications in drug discovery. Drug Discovery Today: HTS supplement. 2000;1(1):38–41.
Publication types
MeSH terms
Substances
Grants and funding
LinkOut - more resources
Full Text Sources
Other Literature Sources
