

Genetic integration of molar cusp size variation in baboons
- PMID: 20034010
- PMCID: PMC2914092
- DOI: 10.1002/ajpa.21221
Genetic integration of molar cusp size variation in baboons
Abstract
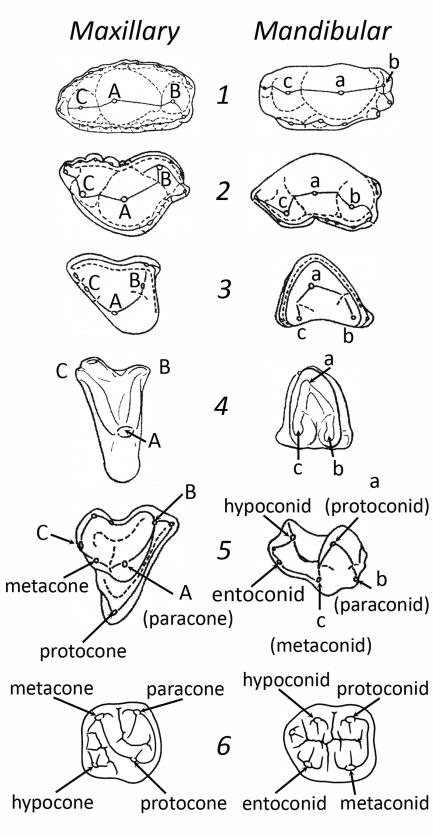
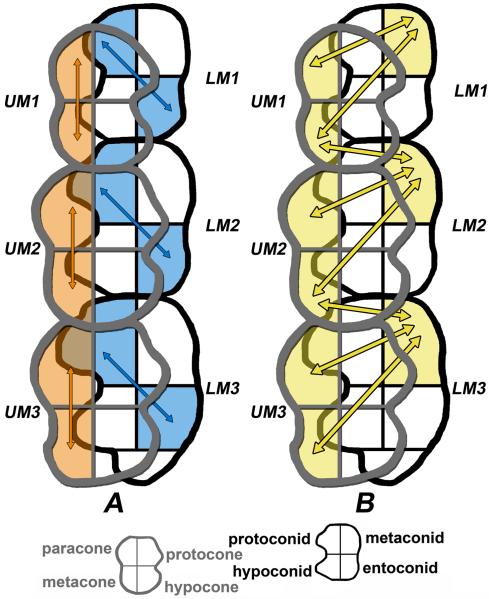
Many studies of primate diversity and evolution rely on dental morphology for insight into diet, behavior, and phylogenetic relationships. Consequently, variation in molar cusp size has increasingly become a phenotype of interest. In 2007 we published a quantitative genetic analysis of mandibular molar cusp size variation in baboons. Those results provided more questions than answers, as the pattern of genetic integration did not fit predictions from odontogenesis. To follow up, we expanded our study to include data from the maxillary molar cusps. Here we report on these later analyses, as well as inter-arch comparisons with the mandibular data. We analyzed variation in two-dimensional maxillary molar cusp size using data collected from a captive pedigreed breeding colony of baboons, Papio hamadryas, housed at the Southwest National Primate Research Center. These analyses show that variation in maxillary molar cusp size is heritable and sexually dimorphic. We also estimated additive genetic correlations between cusps on the same crown, homologous cusps along the tooth row, and maxillary and mandibular cusps. The pattern for maxillary molars yields genetic correlations of one between the paracone-metacone and protocone-hypocone. Bivariate analyses of cuspal homologues on adjacent teeth yield correlations that are high or not significantly different from one. Between dental arcades, the nonoccluding cusps consistently yield high genetic correlations, especially the metaconid-paracone and metaconid-metacone. This pattern of genetic correlation does not immediately accord with the pattern of development and/or calcification, however these results do follow predictions that can be made from the evolutionary history of the tribosphenic molar.
Copyright 2009 Wiley-Liss, Inc.
Figures

Similar articles
-
Genetic correlations between mandibular molar cusp areas in baboons.Am J Phys Anthropol. 2007 Mar;132(3):445-54. doi: 10.1002/ajpa.20528. Am J Phys Anthropol. 2007. PMID: 17154363
-
Statistical genetics of molar cusp patterning in pedigreed baboons: implications for primate dental development and evolution.J Exp Zool B Mol Dev Evol. 2004 May 15;302(3):268-83. doi: 10.1002/jez.b.21. J Exp Zool B Mol Dev Evol. 2004. PMID: 15211686
-
Evolution of M1 crown size and cusp proportions in the genus Homo.J Anat. 2009 May;214(5):655-70. doi: 10.1111/j.1469-7580.2009.01064.x. J Anat. 2009. PMID: 19438761 Free PMC article.
-
A multivariate comparison of dental variation in wild and captive populations of baboons (Papio hamadryas).Arch Oral Biol. 2007 Feb;52(2):195-200. doi: 10.1016/j.archoralbio.2006.09.008. Epub 2006 Oct 17. Arch Oral Biol. 2007. PMID: 17049484 Free PMC article.
-
Primate tooth crown nomenclature revisited.PeerJ. 2023 Jan 12;11:e14523. doi: 10.7717/peerj.14523. eCollection 2023. PeerJ. 2023. PMID: 36650833 Free PMC article. Review.
Cited by
-
Morphometric analysis of molars in a Middle Pleistocene population shows a mosaic of 'modern' and Neanderthal features.J Anat. 2013 Oct;223(4):353-63. doi: 10.1111/joa.12090. Epub 2013 Aug 5. J Anat. 2013. PMID: 23914934 Free PMC article.
-
Six million years of vole dental evolution shaped by tooth development.Proc Natl Acad Sci U S A. 2025 Aug 5;122(31):e2505624122. doi: 10.1073/pnas.2505624122. Epub 2025 Jul 31. Proc Natl Acad Sci U S A. 2025. PMID: 40743389
-
Baboons as a model to study genetics and epigenetics of human disease.ILAR J. 2013;54(2):106-21. doi: 10.1093/ilar/ilt038. ILAR J. 2013. PMID: 24174436 Free PMC article. Review.
-
Maternal effects on offspring mortality in rhesus macaques (Macaca mulatta).Am J Primatol. 2013 Mar;75(3):238-51. doi: 10.1002/ajp.22117. Epub 2013 Jan 11. Am J Primatol. 2013. PMID: 23315583 Free PMC article.
-
Genetic Correlation, Pleiotropy, and Molar Morphology in a Longitudinal Sample of Australian Twins and Families.Genes (Basel). 2022 Jun 2;13(6):996. doi: 10.3390/genes13060996. Genes (Basel). 2022. PMID: 35741762 Free PMC article.
References
-
- Bailey SE. A morphometric analysis of maxillary molar crowns of Middle-Late Pleistocene hominins. J Hum Evol. 2004;47:183–198. - PubMed
-
- Berkovitz BKB. The order of cusp development on the molar teeth of Setonix brachyurus (Macropodidae: Marsupialia) J Roy Soc Western Australia. 1967;50:41–48.
-
- Biggerstaff RH. Cusp size, sexual dimorphism, and the heritability of maxillary molar cusp size in twins. J Dent Res. 1976;55:189–195. - PubMed
Publication types
MeSH terms
Grants and funding
LinkOut - more resources
Full Text Sources
