. 2009 Dec 24:10:447.
doi: 10.1186/1471-2105-10-447.

Next generation transcriptomes for next generation genomes using est2assembly

Affiliations

Next generation transcriptomes for next generation genomes using est2assembly

Alexie Papanicolaou et al. BMC Bioinformatics. .

Abstract

Background: The decreasing costs of capillary-based Sanger sequencing and next generation technologies, such as 454 pyrosequencing, have prompted an explosion of transcriptome projects in non-model species, where even shallow sequencing of transcriptomes can now be used to examine a range of research questions. This rapid growth in data has outstripped the ability of researchers working on non-model species to analyze and mine transcriptome data efficiently.

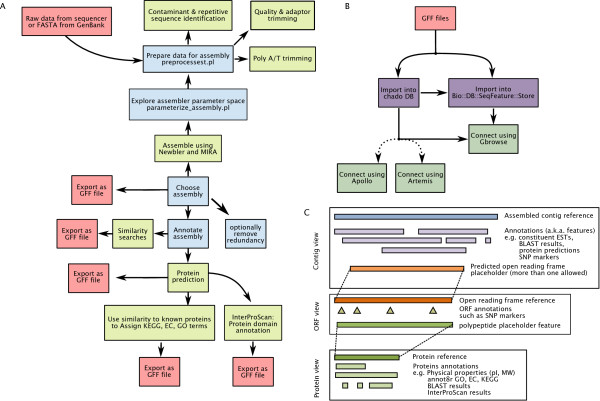
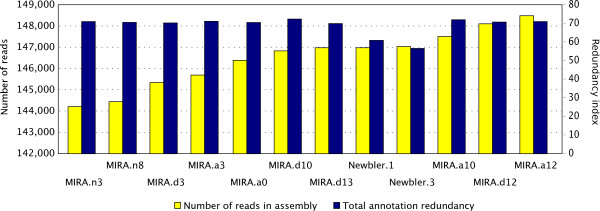
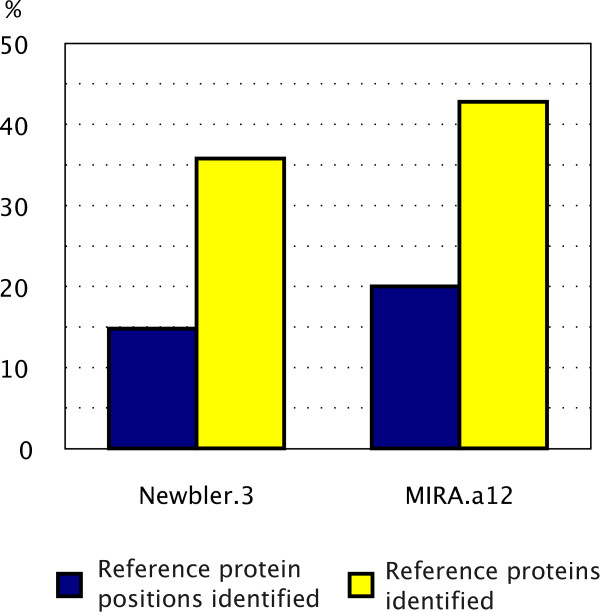
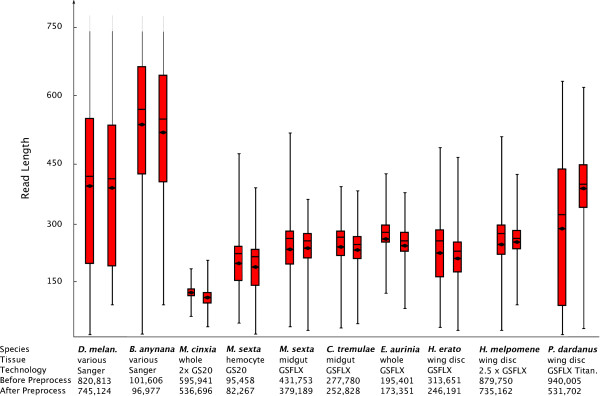
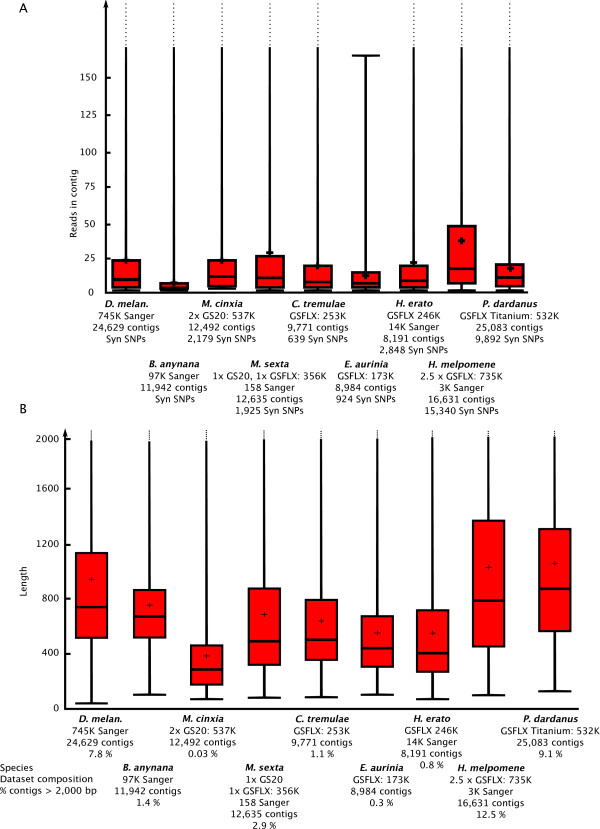
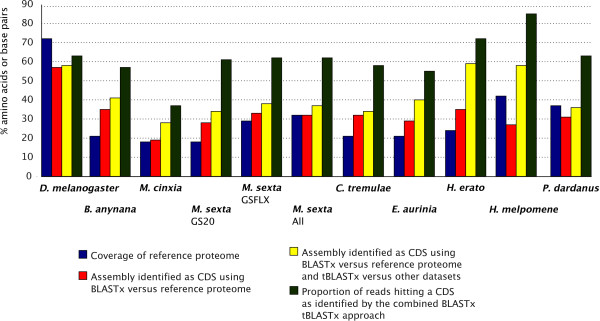
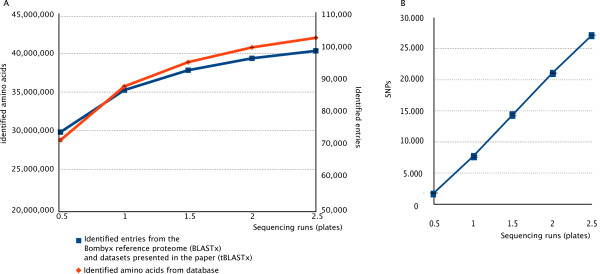
Results: Here we present a semi-automated platform 'est2assembly' that processes raw sequence data from Sanger or 454 sequencing into a hybrid de-novo assembly, annotates it and produces GMOD compatible output, including a SeqFeature database suitable for GBrowse. Users are able to parameterize assembler variables, judge assembly quality and determine the optimal assembly for their specific needs. We used est2assembly to process Drosophila and Bicyclus public Sanger EST data and then compared them to published 454 data as well as eight new insect transcriptome collections.

Conclusions: Analysis of such a wide variety of data allows us to understand how these new technologies can assist EST project design. We determine that assembler parameterization is as essential as standardized methods to judge the output of ESTs projects. Further, even shallow sequencing using 454 produces sufficient data to be of wide use to the community. est2assembly is an important tool to assist manual curation for gene models, an important resource in their own right but especially for species which are due to acquire a genome project using Next Generation Sequencing.


Figures

Figure 1
Figure 1
Schematic diagram of the est2assembly platform. (A) Sub-routines processing and annotating the EST data. Note that all outputs are in the common GFF standard and therefore can be accessed by GMOD-compatible software. (B) Diagram illustrating the the ability of est2assembly to produce a GBrowse sequence view. (C) Diagram illustrating a triple page approach to graphical outputs from est2assembly: First, a page showing the assembled contig and associated annotation, second, a page showing each predicted ORF and its annotation and, third, a page focused around the annotated protein object. Note that each page is linked and allows for rapid navigation to genes of interest.
Figure 2
Figure 2
Exploration of the parameter space on the E. aurinia dataset. Effect of parameterization on assembly is significant. In this dataset, Mira.a0 is the default settings for an 'accurate' assembly. One benchmark is number of reads as lower number of reads result in lower coverage. Another is the redundancy index estimates the level of one-to-many edges (in both directions) exist in an alignment graph between an assembly and the same reference proteome. Newbler seems to outperform MIRA if annotation redundancy is the estimator but see Figure 4.
Figure 3
Figure 3
Comparison of the Newbler.3 and MIRA.a12 assemblers with respect to the numbers of amino acid residues or proteins identified via the est2assembly pipeline. In this E. aurinia dataset, we used the BLASTx similarity to Bombyx mori (cut-off 50 bits) in order to compare performance. MIRA produces an assembly which identifies more of the reference proteome. Further, at this coverage, we do not have a complete coverage of each gene as the proportion of individual amino acids identified is lower (see text for discussion). As this project is a gene-finding one, we choose the MIRA assembly for downstream application.
Figure 4
Figure 4
Boxplot of read length before and after pre-processing for each dataset, showing 25% and 75% intervals, the horizontal bar shows the median, the diamond shows the mean, whiskers encompass entire data range. Such information offers an overall picture of a sequencing run's quality.
Figure 5
Figure 5
Boxplot of (A) number of reads assembled in each contig and (B) contig length for each dataset, showing 25% and 75% intervals, the horizontal bar shows the median, the plus sign shows the mean, whiskers encompass entire data range. Sanger technology has been considered a cleaner technique despite a higher cost but the B. anynana dataset (ca 97K sequences) performs poorly when compared to GSFLX. The earlier GS20 technology is significantly inferior and of limited use in transcriptome sequencing.
Figure 6
Figure 6
Comparison of the number of genes and proteins identified using different 454 based sequencing technologies (GS20, GSFLX and GSFLX-Titanium). For each dataset, the accuracy of the results depends on how similar the target and reference transcriptomes are and the improvement with tBLASTx is an indication of novel protein data supported by at least two species. Such cases warrant a more thorough investigation and can result in the determination of taxon specific- or rapidly evolving genes. The proportion of reads from the sequencer (after pre-processing) which are part of these coding regions is also shown. This can guide future project designs which wish to aim to alter the representation of non-coding in the sequenced sample.
Figure 7
Figure 7
Saturation curve of 454 GSFLX sequencing using the H. melpomene dataset. The error bars show the min/max of each data point as verified with 5 independent pseudo-samples. (A) Researchers can obtain a substantial number of genes with data from one half-plate with saturation for the transcriptome of this sample near the 2.5 plates. (B) SNP marker identification is linear in this dataset with an average of 1,757 high quality SNPs identified in one half-plate.

References

    1. Van Straalen NM, Roelofs D. An introduction to ecological genomics. Oxford: Oxford University Press; 2006.
    1. Heckel DG, Gahan LJ, Daly JC, Trowell S. A genomic approach to understanding Heliothis and Helicoverpa resistance to chemical and biological insecticides. Philos Trans R Soc Lond B Biol Sci. 1998;353:1713–1722.
    1. Brakefield PM, Gates J, Keys D, Kesbeke F, Wijngaarden PJ, Monteiro A, French V, Carroll SB. Development, plasticity and evolution of butterfly eyespot patterns. Nature. 1996;384:236–242. - PubMed
    1. Rausher MD. In: Insect chemical ecology: an evolutionary approach. Rausher MD, Isman MB, editor. New York: Chapman & Hall; 1992. Natural selection and the evolution of plant insect interactions; pp. 20–88.
    1. Ewing B, Green P. Analysis of expressed sequence tags indicates 35,000 human genes. Nat Genet. 2000;25:232–234. - PubMed

Publication types

LinkOut - more resources