. 2009 Dec 24:4:54.
doi: 10.1186/1750-1326-4-54.

Nitrosamine exposure exacerbates high fat diet-mediated type 2 diabetes mellitus, non-alcoholic steatohepatitis, and neurodegeneration with cognitive impairment

Affiliations

Nitrosamine exposure exacerbates high fat diet-mediated type 2 diabetes mellitus, non-alcoholic steatohepatitis, and neurodegeneration with cognitive impairment

Suzanne M de la Monte et al. Mol Neurodegener. .

Abstract

Background: The current epidemics of type 2 diabetes mellitus (T2DM), non-alcoholic steatohepatitis (NASH), and Alzheimer's disease (AD) all represent insulin-resistance diseases. Previous studies linked insulin resistance diseases to high fat diets or exposure to streptozotocin, a nitrosamine-related compound that causes T2DM, NASH, and AD-type neurodegeneration. We hypothesize that low-level exposure to nitrosamines that are widely present in processed foods, amplifies the deleterious effects of high fat intake in promoting T2DM, NASH, and neurodegeneration.

Methods: Long Evans rat pups were treated with N-nitrosodiethylamine (NDEA) by i.p. Injection, and upon weaning, they were fed with high fat (60%; HFD) or low fat (5%; LFD) chow for 6 weeks. Rats were evaluated for cognitive impairment, insulin resistance, and neurodegeneration using behavioral, biochemical, molecular, and histological methods.

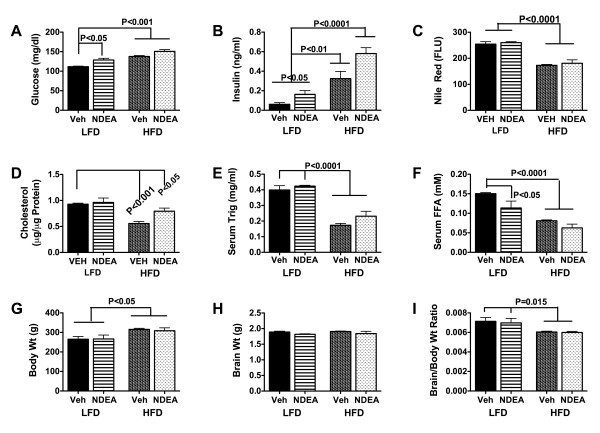
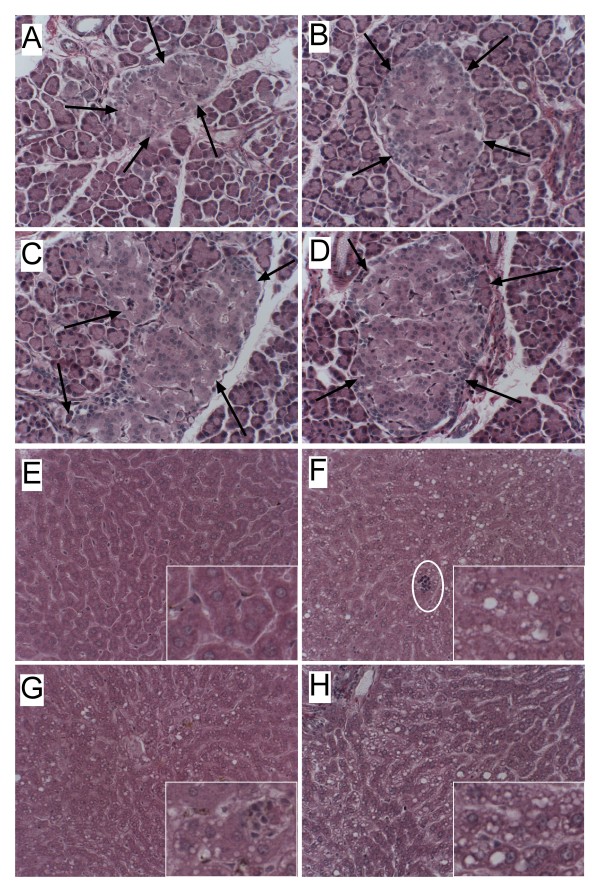
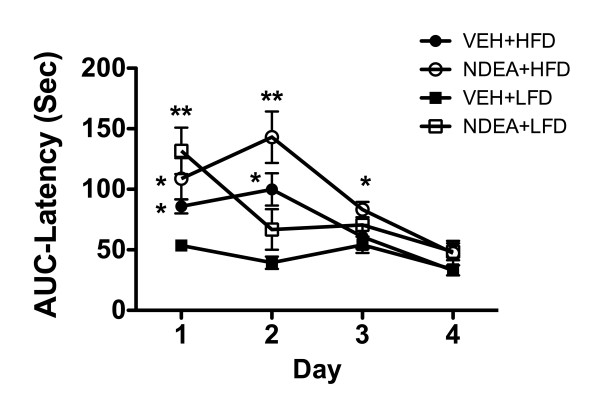
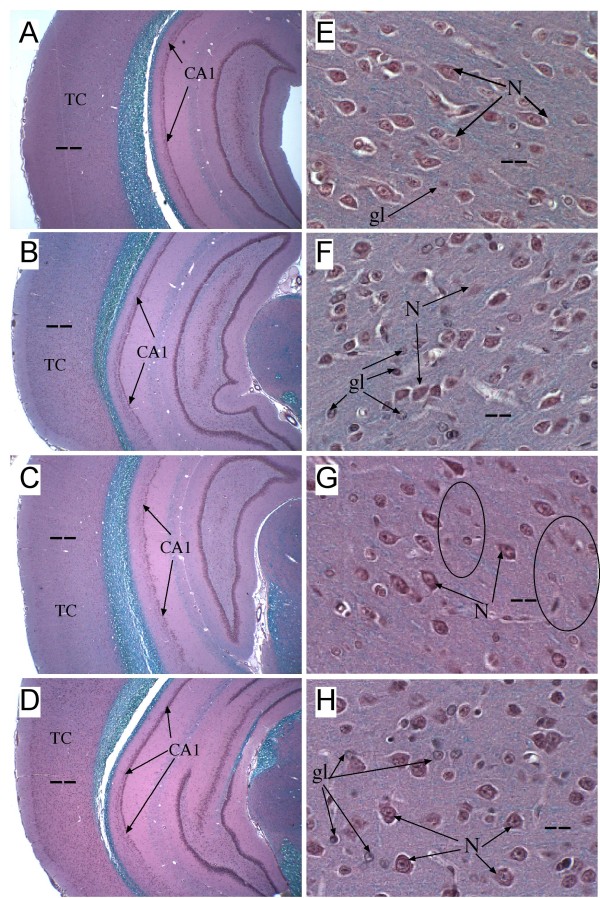
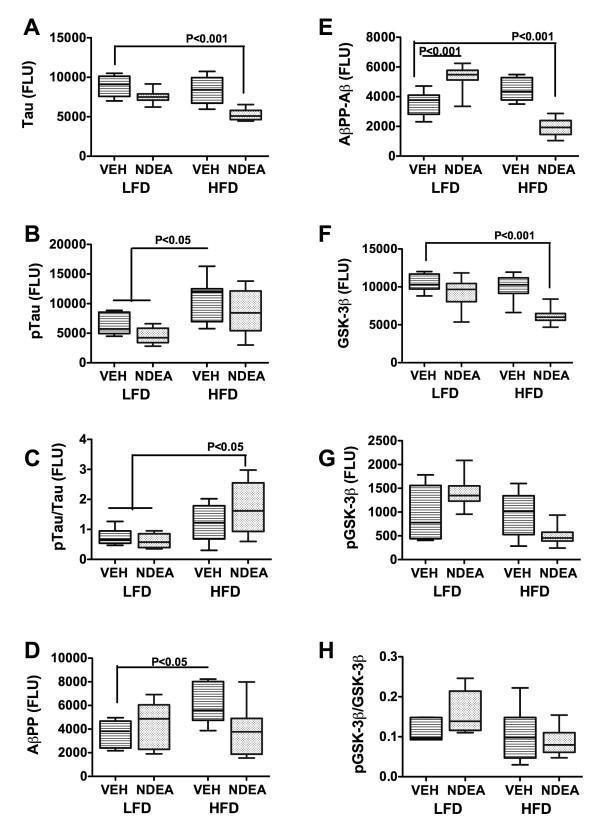
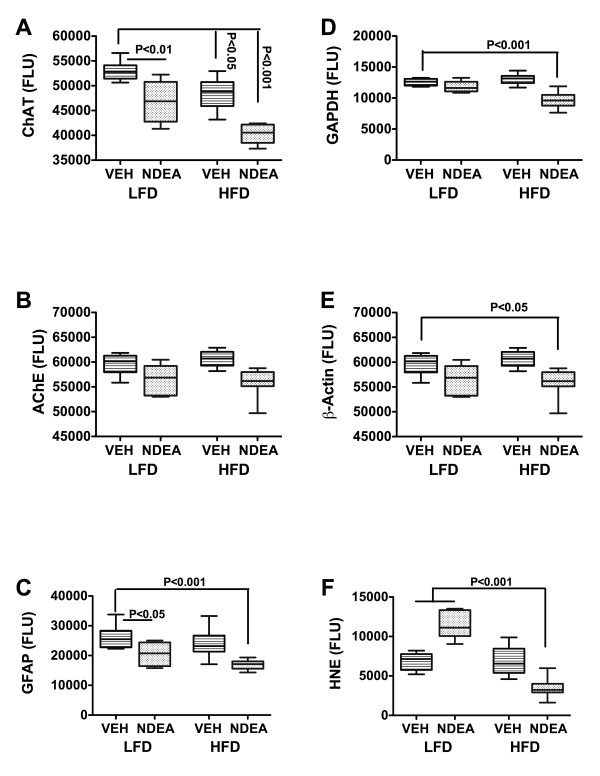
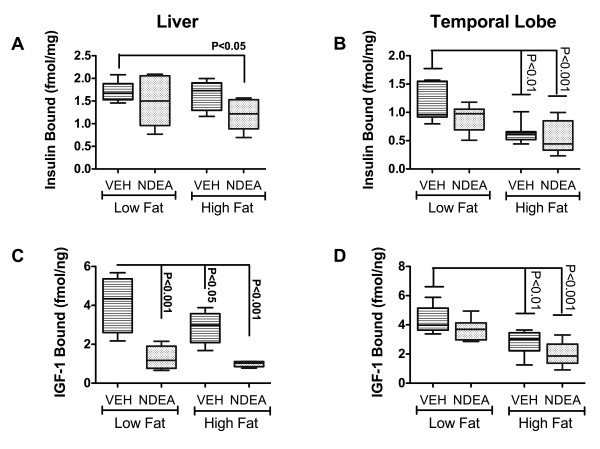
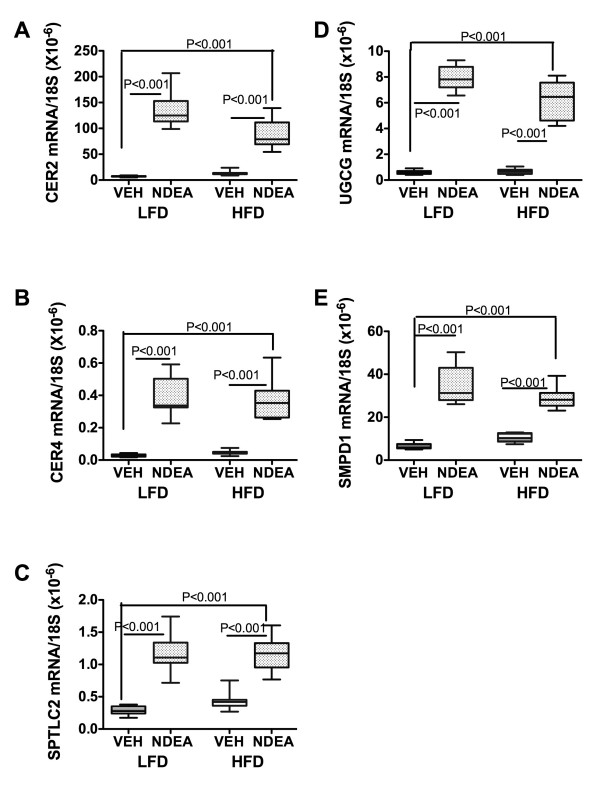
Results: NDEA and HFD +/- NDEA caused T2DM, NASH, deficits in spatial learning, and neurodegeneration with hepatic and brain insulin and/or IGF resistance, and reductions in tau and choline acetyltransferase levels in the temporal lobe. In addition, pro-ceramide genes, which promote insulin resistance, were increased in livers and brains of rats exposed to NDEA, HFD, or both. In nearly all assays, the adverse effects of HFD+NDEA were worse than either treatment alone.

Conclusions: Environmental and food contaminant exposures to low, sub-mutagenic levels of nitrosamines, together with chronic HFD feeding, function synergistically to promote major insulin resistance diseases including T2DM, NASH, and AD-type neurodegeneration. Steps to minimize human exposure to nitrosamines and consumption of high-fat content foods are needed to quell these costly and devastating epidemics.


Figures

Figure 1
Figure 1
NDEA and HFD Feeding Cause T2DM Without Hyper-lipidemia: Long Evans rats were treated with 3 i.p. injections of vehicle or NDEA (N = 12/group) on alternate days beginning on postnatal day 3 (P3). From P21 (weaning), rats were fed with high fat (60% of calories) or low fat (5% of calories) diets for 6 weeks. Serum harvested at the time of sacrifice and after an over-night fast was used to measure (A) glucose, (B) insulin, (C) Nile Red fluorescence (neutral lipids), (D) cholesterol, (E) triglycerides, and (F) free fatty acids. In addition, the mean (G) body weights, (H) brain weights, and (I) calculated brain weight/body weight ratios at the time of sacrifice are shown. Graphs depict the mean ± S.E.M. results for each group. Data were analyzed using repeated measures ANOVA and the post-hoc Dunn's test. Significant inter-group differences are indicated by the P-values over the bars.
Figure 2
Figure 2
NDEA Exposure and Chronic HFD Feeding Induce Pancreatic Islet hypertrophy and Steatohepatitis. Long Evans rats were treated with sub-mutagenic doses of NDEA or vehicle (Veh) and then fed with high (HFD) or low fat (LFD) containing chow for 6 weeks (see legend to Figure 1). Pancreas and liver tissues were immersion fixed and embedded in paraffin. Histological sections were stained with H&E. Photomicrographs depict (A-D) pancreas or (E-H) liver from (A, E) LFD+Veh control, (B, F) HFD+Veh, (C, G) LFD+NDEA, and (D, H) HFD+NDEA treated rats. Note enlarged islets in Panels B, C, and D relative to A (arrows). (F) Chronic HFD feeding increased hepatic macrosteatosis (mainly large clear vacuoles; inset) and foci of lymph-mononuclear cell inflammation (encircled) relative to (E) control. Treatment with (G) NDEA resulted in disruption of the regular chord-like arrangement of hepatocytes, increased macro- (large) and microvesicular (small) steatosis, and increased foci of inflammation, and necrosis (inset). (H) NDEA+HFD exposure further disrupted the hepatic chord architecture, and increased the density of lipid vacuoles (inset), and foci of inflammation and necrosis. A-D, Original magnification 400×; E-H Original magnifications, Panels-80×; insets-650×.
Figure 3
Figure 3
NDEA Treatment and Chronic HFD Feeding Impair Spatial Learning and Memory: Long Evans rats were treated with NDEA or vehicle (VEH) by i.p. injection (N = 12/group), and then chronically fed with high fat (HFD) or low fat (LFD) containing chow for 6 weeks (see Figure Legend 1). Rats were subjected to Morris Water Maze testing on 4 consecutive days. On Day 1, the platform was visible, but on Days 2-4, the platform was submerged, and on Days 3-4, the water entry quadrant was randomized. On each testing day, rats were given 3 trials, with a maximum of 120 seconds allowed to land on the platform, beyond which they were guided. Area under curve (AUC) was calculated for each series of trials each day. Graphs depict the mean ± S.E.M. AUC latencies for each group on each day of testing. Data were analyzed using the Kruskal-Wallis one-way ANOVA and Dunn's multiple comparison post-hoc test for significance. Significant P-values relative to control (VEH+LFD) are indicated by asterisks (*P < 0.05; **P < 0.01).
Figure 4
Figure 4
Hippocampus and Temporal Lobe Degeneration Following NDEA-Exposure and/or HFD Feeding: Long Evans rats treated with NDEA or vehicle (Veh) by i.p. injection (N = 12/group), and then chronically fed with high fat (HFD) or low fat (LFD) containing chow for 6 weeks (see Figure Legend 1). Brains were immersion fixed and embedded in paraffin. Histological sections were stained with Luxol fast blue, H&E. Blue staining corresponds to myelinated fibers and tracts. Photomicrographs depict (A-D) low magnification images of temporal cortex (TC) and hippocampal formation and (E-H) high magnification images of the temporal cortex. Note the thinning/reduced cell density within the CA1 region (Segment 1 of Ammon's Horn; arrows) of the hippocampal formation and slight thinning of the TC in brains of (B) Veh+HFD, (C) NDEA+LFD, and (D) NDEA+HFD treated rats relative to control (A) Veh+LFD). Higher magnification images of TC show (E) abundant pyramidal neurons (N) with regular organization and scattered glia (gl) in LFD+Veh treated control brains, (F) neuronal atrophy and apoptosis (N; arrows) and increased glia (gl) in Veh+HFD treated rats, and (G, H) conspicuous neuronal loss with small clusters of apoptotic cells (encircled) in NDEA ± HFD-treated rats. In addition, as observed in the HFD-fed rat brains, glial cells were conspicuously increased relative to neurons in the (H) HFD+NDEA treated temporal cortex. Original magnifications: A-D, 40×; E-H, 400×. (Scale bar A-D, 200 microns; E-H 25 microns).
Figure 5
Figure 5
Effect of NDEA Exposure and Chronic HFD Feeding on Molecular Indices of Neurodegeneration. Long Evans rats were treated with NDEA or vehicle (VEH) by i.p. injection (N = 12/group), and then chronically fed with high fat (HFD) or low fat (LFD) containing chow for 6 weeks (see Figure Legend 1). Temporal lobe protein homogenates were used to measure (A) Tau; (B) phospho (p)-Tau; (D) AβPP, (E) AβPP-Aβ, (F) GSK-3β, or (G) phospho (p)-GSK-3β by direct binding ELISA. In addition, the ratios of (C) pTau/Tau and (H) pGSK-3β/GSK-3β were calculated. Immunoreactivity was detected with HRP-conjugated secondary antibody and Amplex Red soluble fluorophor. Fluorescence light units (FLU) were measured (Ex 579 nm/Em 595 nm) in a Spectromax M5, and results were normalized to protein content in the wells. Box plots depict mean ± S.E.M of results. Inter-group comparisons were made using ANOVA with the post-hoc Bonferroni test of significance. Significant P-values are indicated within the panels.
Figure 6
Figure 6
Effect of NDEA Exposure and Chronic HFD feeding on Molecular Indices of Oxidative Stress and Neurodegeneration. Long Evans rats were treated with NDEA or vehicle (VEH) by i.p. injection (N = 12/group), and then chronically fed with high fat (HFD) or low fat (LFD) chow for 6 weeks (see Figure Legend 1). Temporal lobe protein homogenates were used to measure (A) choline acetyltransferase (ChAT), (B) acetylcholinesterase (AChE), (C) GFAP, (D) GAPDH, (E) β-Actin, or (F) 4-hydroxynonenal (HNE) by direct binding ELISA. Immunoreactivity was detected with HRP-conjugated secondary antibody and Amplex Red soluble fluorophor. Fluorescence light units (FLU) were measured (Ex 579 nm/Em 595 nm) in a Spectromax M5, and results were normalized to sample protein content in the wells. Box plots depict mean ± S.E.M of results. Inter-group comparisons were made using ANOVA with the post-hoc Bonferroni test of significance. Significant P-values are indicated within the panels.
Figure 7
Figure 7
NDEA Exposure and Chronic HFD Feeding Impair Insulin and IGF-1 Receptor Binding in Liver and Brain. Long Evans rats were treated with NDEA or vehicle (VEH) by i.p. injection (N = 12/group), and then chronically fed with high fat (HFD) or low fat (LFD) containing chow for 6 weeks (see Figure Legend 1). Competitive equilibrium binding studies were used to measure specific insulin and IGF-1 binding to their corresponding receptors. Reactions were incubated with 50 nCi/ml of [125I] (2000 Ci/mmol; 50 pM) insulin or IGF-I in binding buffer in the presence or absence of 0.1 μM unlabeled ligand. Radiolabeled bound ligand was harvested onto 96-well GF/C filter plates and measured in a TopCount. Specific binding was calculated by subtracting non-specifically bound from the total bound isotope. Box plots depict mean ± S.D. of specific binding for (A, B) insulin and (C, D) IGF-I in (A, C) liver and (B, D) temporal lobe. Inter-group comparisons were made using ANOVA with the post-hoc Bonferroni test of significance. Significant P-values are indicated within the panels.
Figure 8
Figure 8
Effect of NDEA exposure and chronic HFD feeding on pro-ceramide gene expression in liver. Long Evans rats treated with NDEA or vehicle (VEH) by i.p. injection (N = 8/group), and then chronically fed with high fat (HFD) or low fat (LFD) containing chow for 6 weeks (see Figure Legend 1). Total RNA extracted from liver tissue was reverse transcribed using random oligodeoxynucleotide primers, and the resulting cDNA templates were used in qRT-PCR assays to measure (A) Ceramide synthase (CER) 2, (B) CER4, (C) Serine palmitoyltransferase 2 (SPTLC2), (D) UDP-glucose ceramide glycoysltransferase (UGCG), or (E) sphingomyelin phosphodiesterase 1 (SMPD1). The mRNA levels were normalized to 18S rRNA measured in the same templates. Graphs depict the mean ± S.E.M. levels of gene expression. Inter-group comparisons were made using ANOVA with the post-hoc Bonferroni test of significance. Significant P-values are indicated within the panels.

Similar articles

Cited by

References

    1. Rector RS, Thyfault JP, Wei Y, Ibdah JA. Non-alcoholic fatty liver disease and the metabolic syndrome: an update. World J Gastroenterol. 2008;14(2):185–192. doi: 10.3748/wjg.14.185. - DOI - PMC - PubMed
    1. Pradhan A. Obesity, metabolic syndrome, and type 2 diabetes: inflammatory basis of glucose metabolic disorders. Nutr Rev. 2007;65(12 Pt 2):S152–156. doi: 10.1111/j.1753-4887.2007.tb00354.x. - DOI - PubMed
    1. Launer LJ. Next steps in Alzheimer's disease research: interaction between epidemiology and basic science. Curr Alzheimer Res. 2007;4(2):141–143. doi: 10.2174/156720507780362155. - DOI - PubMed
    1. Wang G, Silva J, Dasgupta S, Bieberich E. Long-chain ceramide is elevated in presenilin 1 (PS1M146V) mouse brain and induces apoptosis in PS1 astrocytes. Glia. 2008;56(4):449–456. doi: 10.1002/glia.20626. - DOI - PubMed
    1. Delgado JS. Evolving trends in nonalcoholic fatty liver disease. Eur J Intern Med. 2008;19(2):75–82. doi: 10.1016/j.ejim.2007.02.034. - DOI - PubMed

LinkOut - more resources