

The effect of Helicobacter hepaticus infection on immune responses specific to herpes simplex virus type 1 and characteristics of dendritic cells
- PMID: 20034428
- PMCID: PMC2798839
The effect of Helicobacter hepaticus infection on immune responses specific to herpes simplex virus type 1 and characteristics of dendritic cells
Abstract
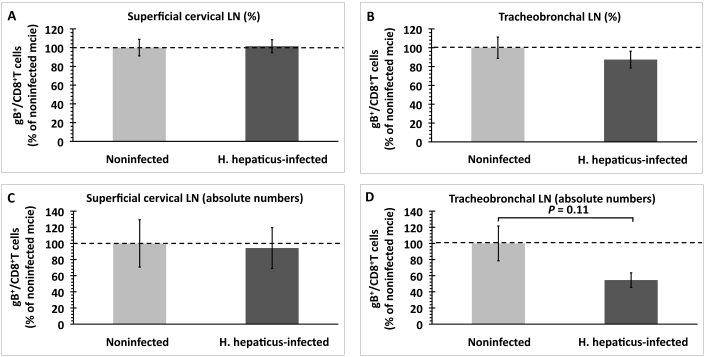
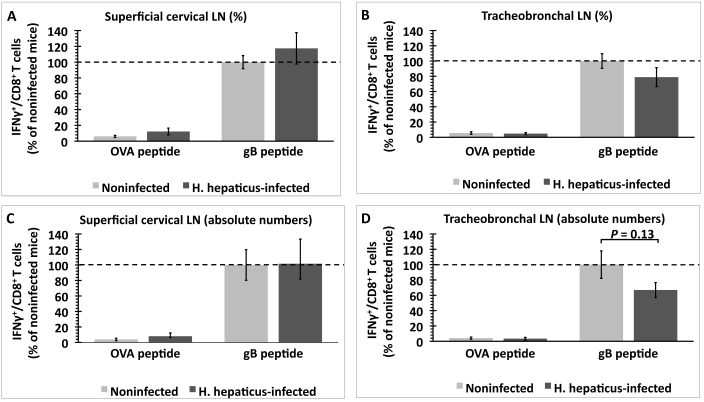
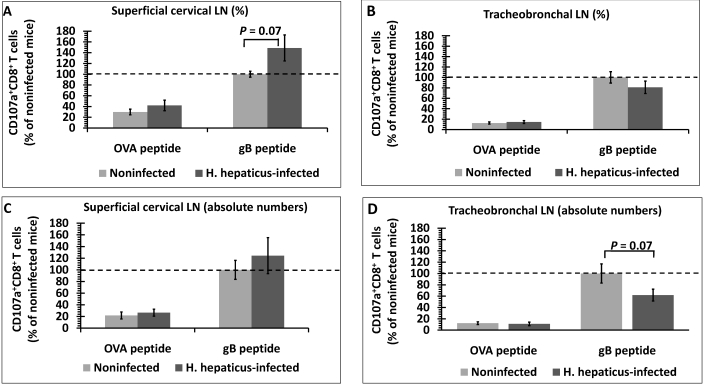
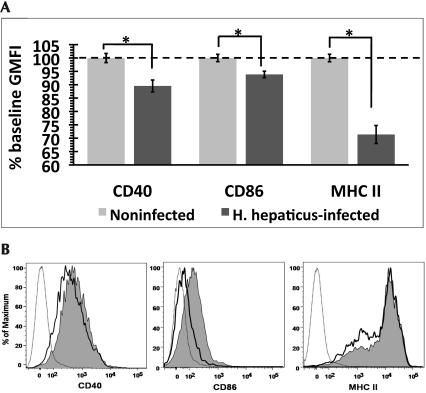
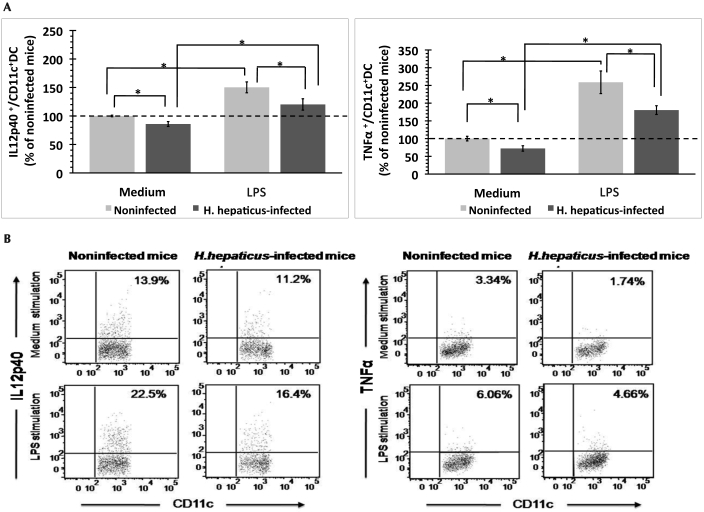
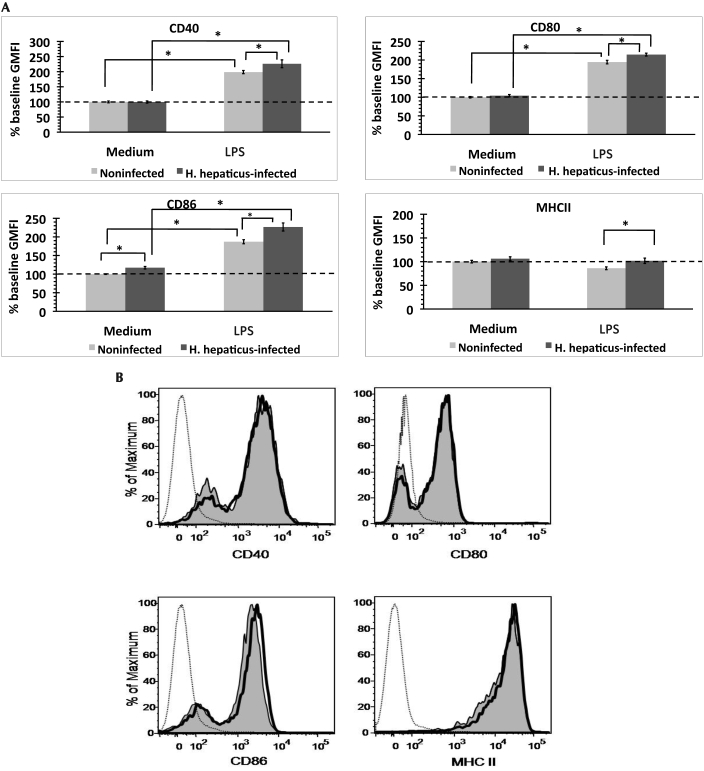
Infection of mice with Helicobacter hepaticus is common in research colonies, yet little is known about how this persistent infection affects immunologic research. The goal of this study was to determine whether H. hepaticus infection status can modulate immune responses specific to herpes simplex virus type 1 (HSV1) and the phenotypic and functional characteristics of dendritic cells (DC) of mice. We compared virus-specific antibody and T cell-mediated responses in H. hepaticus-infected and noninfected mice that were inoculated intranasally with HSV1. The effect of H. hepaticus on the HSV1-specific antibody and T cell-mediated immune responses in superficial cervical and tracheobronchal lymph nodes (LN) did not reach statistical significance. Surface expression of the maturation-associated markers CD40, CD80, CD86, and MHC II and percentages of IL12p40- and TNFalpha-producing DC from spleen and colic LN in H. hepaticus-infected mice and noninfected mice were measured in separate experiments. Expression of CD40, CD86, and MHC II and percentages of IL12p40- and TNFalpha-producing DC from colic LN were decreased in H. hepaticus-infected mice. In contrast, H. hepaticus infection did not reduce the expression of these molecules by splenic DC. Expression of CD40, CD80, CD86, and MHC II on splenic DC from H. hepaticus-infected mice was increased after in vitro lipopolysaccharide stimulation. These results indicate that H. hepaticus infection can influence the results of immunologic assays in mice and support the use of H. hepaticus-free mice in immunologic research.
Figures
Similar articles
-
Modulation of host immune responses by the cytolethal distending toxin of Helicobacter hepaticus.Infect Immun. 2006 Aug;74(8):4496-504. doi: 10.1128/IAI.00503-06. Infect Immun. 2006. PMID: 16861635 Free PMC article.
-
Cytolethal distending toxin is essential for Helicobacter hepaticus colonization in outbred Swiss Webster mice.Infect Immun. 2005 Jun;73(6):3559-67. doi: 10.1128/IAI.73.6.3559-3567.2005. Infect Immun. 2005. PMID: 15908385 Free PMC article.
-
Hcp and VgrG1 are secreted components of the Helicobacter hepaticus type VI secretion system and VgrG1 increases the bacterial colitogenic potential.Cell Microbiol. 2013 Jun;15(6):992-1011. doi: 10.1111/cmi.12094. Epub 2013 Jan 17. Cell Microbiol. 2013. PMID: 23278999
-
Pathogenesis of mouse hepatitis virus infection in gamma interferon-deficient mice is modulated by co-infection with Helicobacter hepaticus.Comp Med. 2003 Apr;53(2):197-206. Comp Med. 2003. PMID: 12784855
-
Helicobacter hepaticus infection in mice: models for understanding lower bowel inflammation and cancer.Mucosal Immunol. 2011 Jan;4(1):22-30. doi: 10.1038/mi.2010.61. Epub 2010 Oct 13. Mucosal Immunol. 2011. PMID: 20944559 Free PMC article. Review.
Cited by
-
Hemorrhage-induced intestinal damage is complement-independent in Helicobacter hepaticus-infected mice.Shock. 2010 Nov;34(5):467-74. doi: 10.1097/SHK.0b013e3181dc077e. Shock. 2010. PMID: 20220569 Free PMC article.
References
-
- Anglen CS, Truckenmiller ME, Schell TD, Bonneau RH. 2003. The dual role of CD8+ T lymphocytes in the development of stress-induced herpes simplex encephalitis. J Neuroimmunol 140:13–27 - PubMed
-
- Bonneau RH, Salvucci LA, Johnson DC, Tevethia SS. 1993. Epitope specificity of H2Kb-restricted, HSV1-, and HSV2-crossreactive cytotoxic T lymphocyte clones. Virology 195:62–70 - PubMed
Publication types
MeSH terms
Substances
Grants and funding
LinkOut - more resources
Full Text Sources
Medical
Molecular Biology Databases
Research Materials