

Interpreting the effect of vaccination on steady state infection in animals challenged with Simian immunodeficiency virus
- PMID: 20034499
- PMCID: PMC2827631
- DOI: 10.1016/j.jtbi.2009.12.018
Interpreting the effect of vaccination on steady state infection in animals challenged with Simian immunodeficiency virus
Abstract
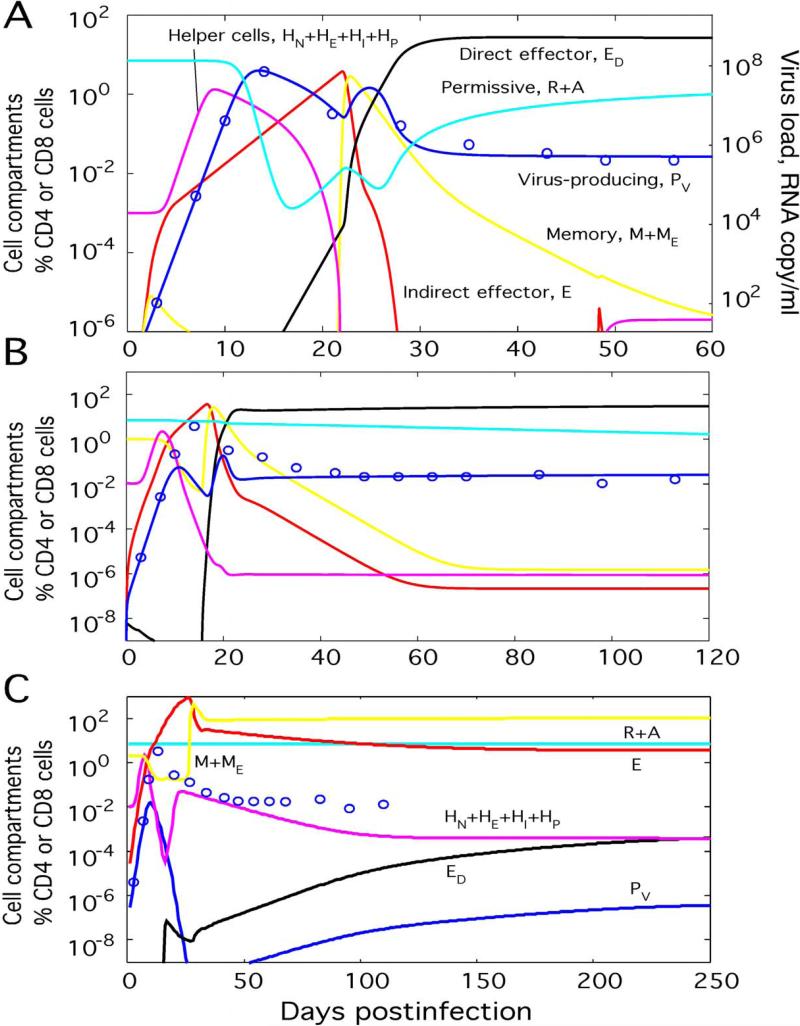
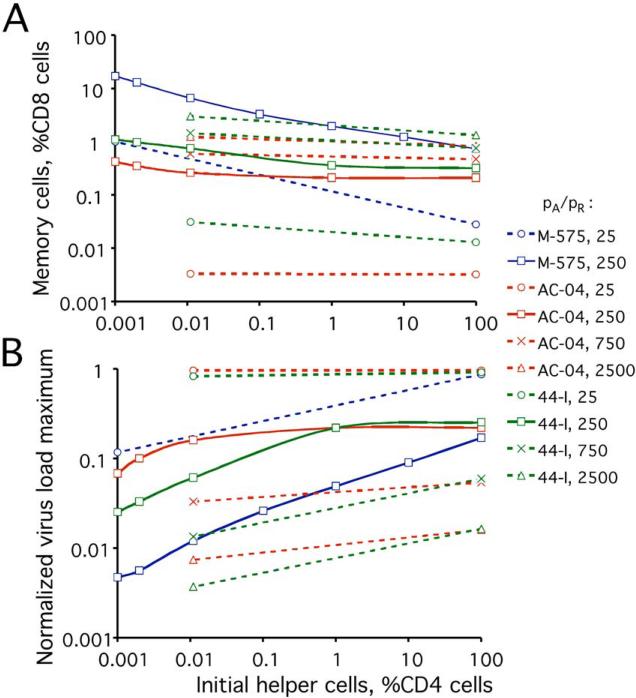
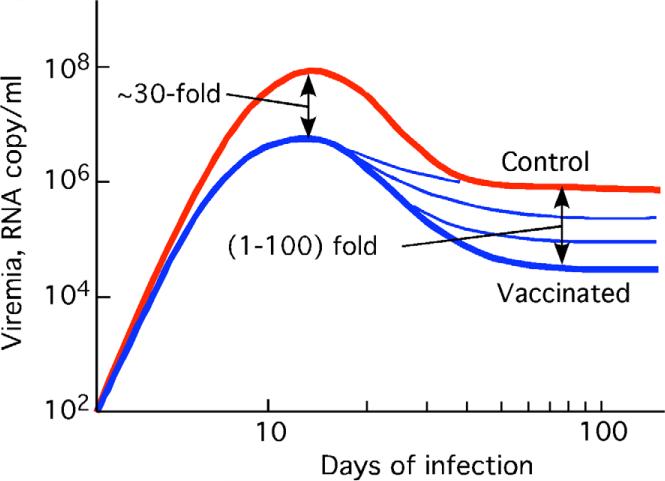
A representative vaccinated macaque challenged with SIVmac251 establishes a persistent infection with a lower virus load, higher CTL frequencies, and much higher helper cell frequencies, than a representative control animal. The reasons for the difference are not fully understood. Here we interpret this effect using a mathematical model we developed recently to explain results of various experiments on virus and CTL dynamics in SIV-infected macaques and HIV-infected humans. The model includes two types of cytotoxic lymphocytes (CTLs) regulated by antigen-activated helper cells and directly by infected cells, respectively, and predicts the existence of two steady states with different viremia, helper cell and CTL levels. Depending on the initial level of CTL memory cells and helper cells, a representative animal ends up in either the high-virus state or the low-virus state, which accounts for the observed differences between the two animal groups. Viremia in the low-virus state is proportional to the antigen sensitivity threshold of helper cells. Estimating the infectivity ratio of activated and resting CD4 T cells at 200-300, the correct range for the critical memory cell percentage and the viremia peak suppression is predicted. However, the model does not explain why viremia in the "low-virus state" is surprisingly high , relative to vaccinated animals infected with SHIV, and broadly distributed among challenged animals. We conclude that the model needs an update explaining extremely low sensitivity of uninfected helper cells to antigen in vaccinated animals.
Copyright 2009 Elsevier Ltd. All rights reserved.
Figures
Similar articles
-
ALVAC-SIV-gag-pol-env-based vaccination and macaque major histocompatibility complex class I (A*01) delay simian immunodeficiency virus SIVmac-induced immunodeficiency.J Virol. 2002 Jan;76(1):292-302. doi: 10.1128/jvi.76.1.292-302.2002. J Virol. 2002. PMID: 11739694 Free PMC article.
-
Early T Follicular Helper Cell Responses and Germinal Center Reactions Are Associated with Viremia Control in Immunized Rhesus Macaques.J Virol. 2019 Feb 5;93(4):e01687-18. doi: 10.1128/JVI.01687-18. Print 2019 Feb 15. J Virol. 2019. PMID: 30463978 Free PMC article.
-
Immunization of macaques with live simian human immunodeficiency virus (SHIV) vaccines conferred protection against AIDS induced by homologous and heterologous SHIVs and simian immunodeficiency virus.Virology. 2002 Sep 30;301(2):189-205. doi: 10.1006/viro.2002.1544. Virology. 2002. PMID: 12359422
-
Vaccination with the Conserved Caveolin-1 Binding Motif in Human Immunodeficiency Virus Type 1 Glycoprotein gp41 Delays the Onset of Viral Infection and Provides Partial Protection in Simian/Human Immunodeficiency Virus-Challenged Cynomolgus Macaques.J Virol. 2018 Aug 29;92(18):e00370-18. doi: 10.1128/JVI.00370-18. Print 2018 Sep 15. J Virol. 2018. PMID: 29976675 Free PMC article.
-
Early helper T-cell dysfunction in simian immunodeficiency virus but not in human immunodeficiency virus type-2-infected macaques.J Med Primatol. 1994 Jul;23(5):298-303. doi: 10.1111/j.1600-0684.1994.tb00287.x. J Med Primatol. 1994. PMID: 7869358
Cited by
-
Modeling the immune response to HIV infection.Curr Opin Syst Biol. 2018 Dec;12:61-69. doi: 10.1016/j.coisb.2018.10.006. Epub 2018 Nov 8. Curr Opin Syst Biol. 2018. PMID: 31463420 Free PMC article.
-
The route of HIV escape from immune response targeting multiple sites is determined by the cost-benefit tradeoff of escape mutations.PLoS Comput Biol. 2014 Oct 30;10(10):e1003878. doi: 10.1371/journal.pcbi.1003878. eCollection 2014 Oct. PLoS Comput Biol. 2014. PMID: 25356981 Free PMC article.
References
-
- Adams BM, Banks HT, Davidian M, Rosenberg ES. Estimation and prediction with HIV-treatment interruption data. Bull. Math. Biol. 2007;69:563–84. - PubMed
-
- Barouch DH, Santra S, Schmitz JE, Kuroda MJ, Fu TM, Wagner W, Bilska M, Craiu A, Zheng XX, Krivulka GR, Beaudry K, Lifton MA, Nickerson CE, Trigona WL, Punt K, Freed DC, Guan L, Dubey S, Casimiro D, Simon A, Davies ME, Chastain M, Strom TB, Gelman RS, Montefiori DC, Lewis MG, Emini EA, Shiver JW, Letvin NL. Control of viremia and prevention of clinical AIDS in rhesus monkeys by cytokine-augmented DNA vaccination. Science. 2000;290:486–92. - PubMed
-
- Cavert W, Notermans DW, Staskus K, Wietgrefe SW, Zupancic M, Gebhard K, Henry K, Zhang ZQ, Mills R, McDade H, Schuwirth CM, Goudsmit J, Danner SA, Haase AT. Kinetics of response in lymphoid tissues to antiretroviral therapy of HIV-1 infection. Science. 1997;276:960–964. - PubMed
-
- Chun TW, Carruth L, Finzi D, Shen X, DiGiuseppe JA, Taylor H, Hermankova M, Chadwick K, Margolick J, Quinn TC, Kuo YH, Brookmeyer R, Zeiger MA, Barditch-Crovo P, Siliciano RF. Quantification of latent tissue reservoirs and total body viral load in HIV-1 infection. Nature. 1997;387:183–188. - PubMed
Publication types
MeSH terms
Substances
Grants and funding
LinkOut - more resources
Full Text Sources
Research Materials
