

Isolation and characterization of human interleukin-10-secreting T cells from peripheral blood
- PMID: 20034527
- PMCID: PMC3399767
- DOI: 10.1016/j.humimm.2009.12.003
Isolation and characterization of human interleukin-10-secreting T cells from peripheral blood
Abstract
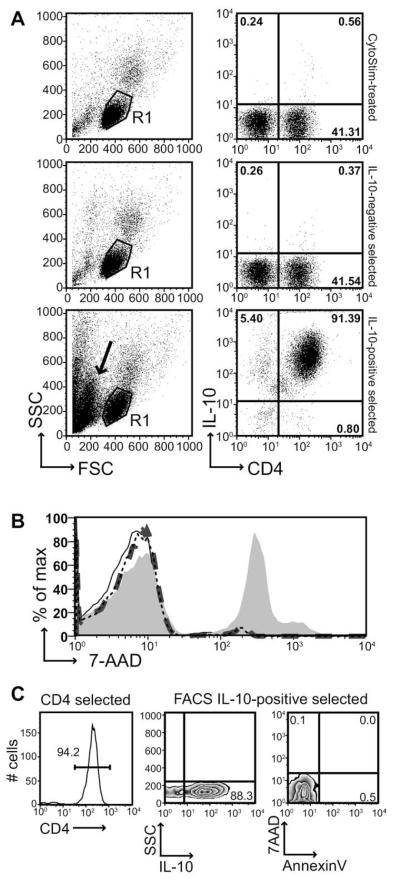
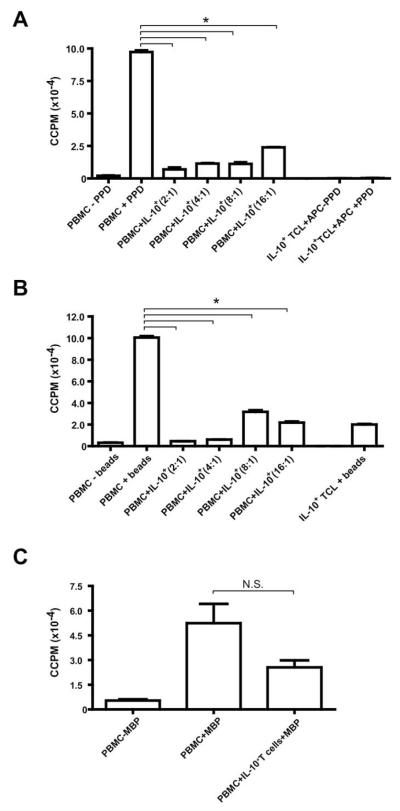
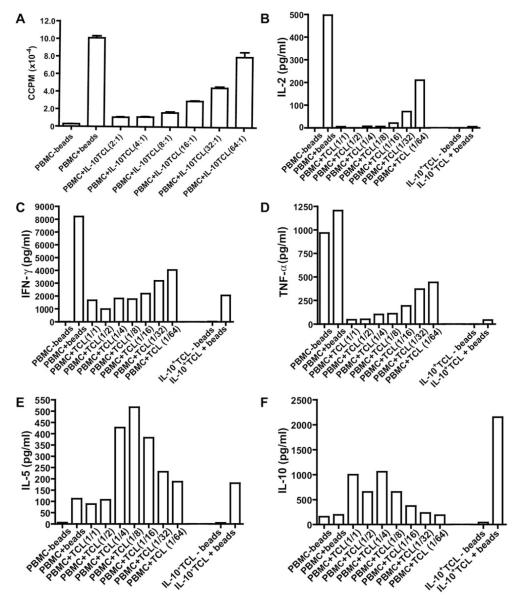
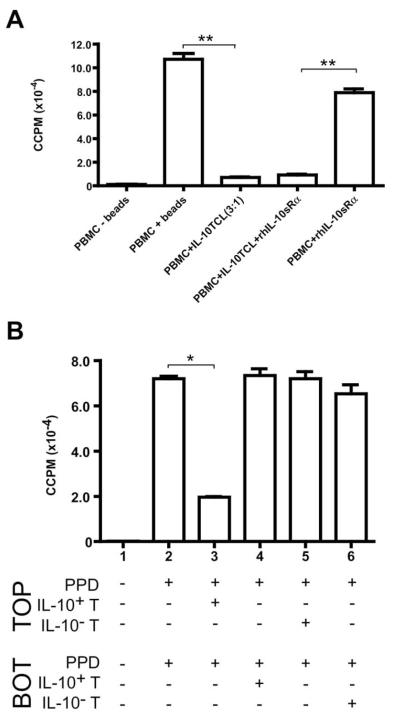
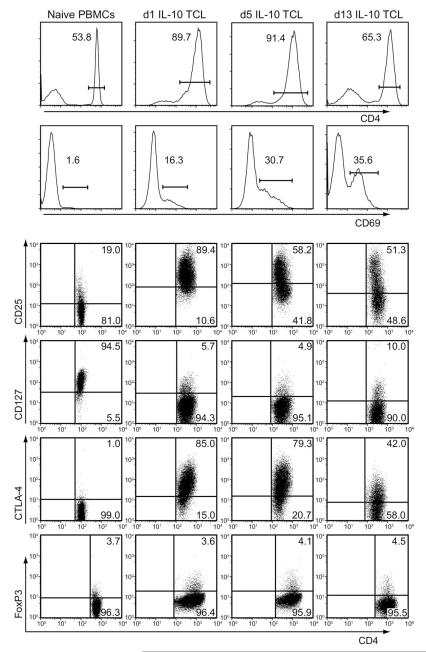
Recent studies have expanded our understanding of the role of the anti-inflammatory cytokine interleukin (IL)-10, produced by multiple lineages of both human and murine T cells, in regulating the immune response. Here, we demonstrate that the small percentage of circulating CD4(+) T cells that secrete IL-10 can be isolated from human peripheral blood and, importantly, we have optimized a protocol to expand these cells in both antigen-specific and polyclonal manners. Expanded CD4(+)IL-10(+) T cells abrogate proliferation and T helper (Th) 1-like cytokine production in an antigen-specific manner, and to a lesser extent exhibit bystander suppressive capacity. CD4(+)IL-10(+) T cells are suppressive in a cell contact-dependent way, though they do not require secretion of IL-10 for their suppressive role in vitro. CD4(+)IL-10(+) T cells have an activated phenotype, with high expression of CD25, CD69, and cytotoxic T-lymphocyte antigen-4, and are largely FoxP3 negative. This novel method for the isolation and expansion of suppressive IL-10-secreting T cells has important implications both for further research and clinical therapeutic development.
(c) 2010 American Society for Histocompatibility and Immunogenetics. Published by Elsevier Inc. All rights reserved.
Figures
Similar articles
-
IL-15 and cognate antigen successfully expand de novo-induced human antigen-specific regulatory CD4+ T cells that require antigen-specific activation for suppression.J Immunol. 2003 Dec 15;171(12):6431-41. doi: 10.4049/jimmunol.171.12.6431. J Immunol. 2003. PMID: 14662842
-
Increased interleukin-10 production by ASC-deficient CD4+ T cells impairs bystander T-cell proliferation.Immunology. 2011 Sep;134(1):33-40. doi: 10.1111/j.1365-2567.2011.03462.x. Epub 2011 Jun 30. Immunology. 2011. PMID: 21718313 Free PMC article.
-
In-vitro generation and characterisation of murine CD4+CD25+ regulatory T cells with indirect allospecificity.Int Immunopharmacol. 2006 Dec 20;6(13-14):1883-8. doi: 10.1016/j.intimp.2006.07.032. Epub 2006 Sep 1. Int Immunopharmacol. 2006. PMID: 17161341
-
The maintenance of human CD4+ CD25+ regulatory T cell function: IL-2, IL-4, IL-7 and IL-15 preserve optimal suppressive potency in vitro.Int Immunol. 2007 Jun;19(6):785-99. doi: 10.1093/intimm/dxm047. Epub 2007 Jun 1. Int Immunol. 2007. PMID: 17545278
-
Induction of interleukin 10-producing, nonproliferating CD4(+) T cells with regulatory properties by repetitive stimulation with allogeneic immature human dendritic cells.J Exp Med. 2000 Nov 6;192(9):1213-22. doi: 10.1084/jem.192.9.1213. J Exp Med. 2000. PMID: 11067871 Free PMC article.
Cited by
-
Cord-blood-derived mesenchymal stromal cells downmodulate CD4+ T-cell activation by inducing IL-10-producing Th1 cells.Stem Cells Dev. 2013 Apr 1;22(7):1063-75. doi: 10.1089/scd.2012.0315. Epub 2013 Jan 4. Stem Cells Dev. 2013. PMID: 23167734 Free PMC article.
-
Rapid detection, enrichment and propagation of specific T cell subsets based on cytokine secretion.Clin Exp Immunol. 2011 Jan;163(1):1-10. doi: 10.1111/j.1365-2249.2010.04261.x. Epub 2010 Oct 21. Clin Exp Immunol. 2011. PMID: 20964638 Free PMC article. Review.
-
Lipid Microbubble-Conjugated Anti-CD3 and Anti-CD28 Antibodies (Microbubble-Based Human T Cell Activator) Offer Superior Long-Term Expansion of Human Naive T Cells In Vitro.Immunohorizons. 2020 Aug 7;4(8):475-484. doi: 10.4049/immunohorizons.2000056. Immunohorizons. 2020. PMID: 32769179 Free PMC article.
-
Controlling immune response and demyelination using highly potent bifunctional peptide inhibitors in the suppression of experimental autoimmune encephalomyelitis.Clin Exp Immunol. 2013 Apr;172(1):23-36. doi: 10.1111/cei.12029. Clin Exp Immunol. 2013. PMID: 23480182 Free PMC article.
-
Tr1-Like T Cells - An Enigmatic Regulatory T Cell Lineage.Front Immunol. 2016 Sep 14;7:355. doi: 10.3389/fimmu.2016.00355. eCollection 2016. Front Immunol. 2016. PMID: 27683580 Free PMC article.
References
-
- Wraith DC, Nicolson KS, Whitley NT. Regulatory CD4+ T cells and the control of autoimmune disease. Curr Opin Immunol. 2004;16:695–701. - PubMed
-
- Weiner HL. Induction and mechanism of action of transforming growth factor-β-secreting Th3 regulatory cells. Immunol Rev. 2001;182:207–14. - PubMed
-
- Battaglia M, Gregori S, Bacchetta R, Roncarolo MG. Tr1 cells: From discovery to their clinical application. Semin Immunol. 2006;18:120–7. - PubMed
-
- Burkhart C, Liu GY, Anderton SM, Metzler B, Wraith DC. Peptide-induced T cell regulation of experimental autoimmune encephalomyelitis: A role for IL-10. Int Immunol. 1999;11:1625–34. - PubMed
Publication types
MeSH terms
Substances
Grants and funding
LinkOut - more resources
Full Text Sources
Research Materials
