. 2010 May;263(1-2):66-77.
doi: 10.1016/j.heares.2009.12.024. Epub 2009 Dec 23.

Motion of the surface of the human tympanic membrane measured with stroboscopic holography

Affiliations

Motion of the surface of the human tympanic membrane measured with stroboscopic holography

Jeffrey Tao Cheng et al. Hear Res. 2010 May.

Abstract

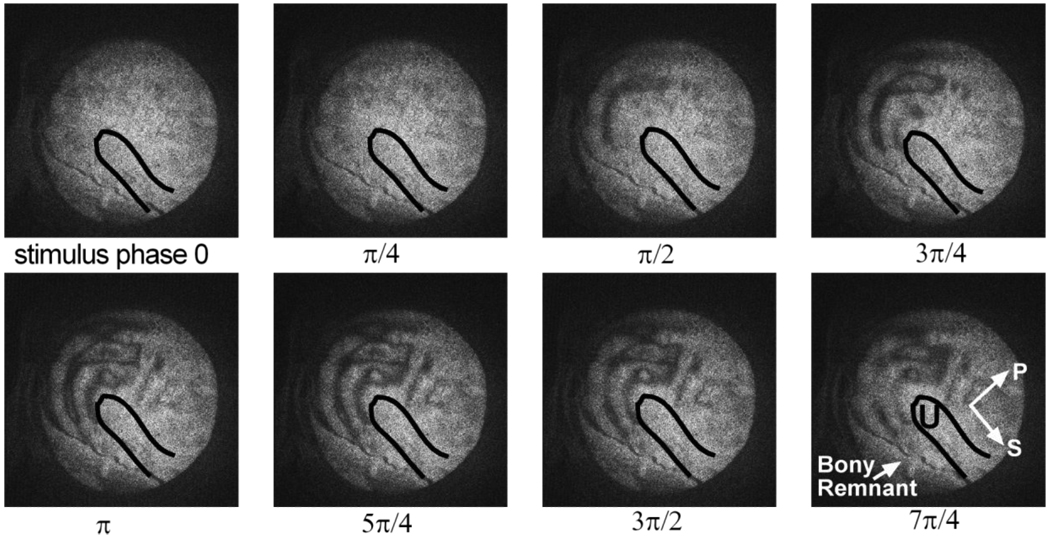
Sound-induced motion of the surface of the human tympanic membrane (TM) was studied by stroboscopic holographic interferometery, which measures the amplitude and phase of the displacement at each of about 40,000 points on the surface of the TM. Measurements were made with tonal stimuli of 0.5, 1, 4 and 8 kHz. The magnitude and phase of the sinusoidal displacement of the TM at each driven frequency were derived from the fundamental Fourier component of the raw displacement data computed from stroboscopic holograms of the TM recorded at eight stimulus phases. The correlation between the Fourier estimates and measured motion data was generally above 0.9 over the entire TM surface. We used three data presentations: (i) plots of the phasic displacements along a single chord across the surface of the TM, (ii) phasic surface maps of the displacement of the entire TM surface, and (iii) plots of the Fourier derived amplitude and phase-angle of the surface displacement along four diameter lines that define and bisect each of the four quadrants of the TM. These displays led to some common conclusions: at 0.5 and 1kHz, the entire TM moved roughly in-phase with some small phase delay apparent between local areas of maximal displacement in the posterior half of the TM. At 4 and 8 kHz, the motion of the TM became more complicated with multiple local displacement maxima arranged in rings around the manubrium. The displacements at most of these maxima were roughly in-phase, while some moved out-of-phase. Superposed on this in- and out-of-phase behavior were significant cyclic variations in-phase with location of less than 0.2 cycles or occasionally rapid half-cycle step-like changes in-phase. The high frequency displacement amplitude and phase maps discovered in this study can not be explained by any single wave motion, but are consistent with a combination of low and higher order modal motions plus some small traveling-wave-like components. The observations of the dynamics of TM surface motion from this study will help us better understand the sound-receiving function of the TM and how it couples sound to the ossicular chain and inner ear.


Figures

Figure 1
Figure 1
Experimental setup and schematic of Opto-electronic Holographic (OEH) Interferometry system. The sinusoid acoustic stimuli are generated by a computer-controlled stimulus generator that drives an earphone. The sound pressure near the TM surface is monitored by a probe-microphone and recorded in the computer via an analog-to-digital (A/D) converter. In stroboscopic holographic measurement mode, the laser beam (473 nm wavelength) is controlled by the ‘strobe switch’ (an opto-acoustic modulator capable of high-frequency switching) which generates a series of stimulus-phase-locked strobed laser pulses with a duration of 10% of the tonal stimulus cycle. The laser pulses are split into a reference beam and an object beam with a beam splitter. The reference beam is subjected to an optical phase shift that changes the optical path length by 0, 1/4, 1/2 or 3/4 of the optical wavelength, and the object beam is sent to illuminate the specimen through a mirror and collimator. The reflected object beam interferes with the reference beam producing interferograms that are recorded by the digital camera of the OEH system. The time varying displacement of the TM is measured by the computer as a series of stroboscopic holograms at different time instants and processed by computer to provide quantitative measurements of the deformations of the TM between two different time instants. (This figure is an expanded version of Fig 1. of Rosowski et al. (2009)).
Figure 2
Figure 2
Stroboscopic holograms of the TM recorded at eight stimulus phases (0, π/4, π/2…7π/4), in which the motion of the TM relative to the reference hologram (the reference is not shown but is a repeated measurement at a stimulus phase of 0) is recorded as spatial variations of the image intensity (Eqn 2). The near-circular window on each image is the edge of the round-shaped speculum which bounds the view of the TM. The manubrium is outlined on each image, while the umbo and the posterior (P) and superior (S) orientations of the bone are marked in the last image taken at stimulus phase of 7π/4.
Figure 3
Figure 3
Results of masking and edge normalization on raw displacement data of the TM at the stimulus frequency of 8 kHz and the stimulus phase of 3π/4. (A) The unwrapped displacement data along one line on the image. (B) As in A, but after application of the Mask. (C) As in B, but after normalization by the mean value at the edge. (D) A surface view of the displacement data reconstructed after phase-unwrapping of the raw displacement data. The orientation of the TM is identified by the outline of the manubrium (thick solid black line) on the TM surface, with the dotted line showing the line used in plots A through C. The narrow inward spike used to define the zero displacement position is marked by a dotted circle at the bottom. (E) The mask used to exclude regions outside the surface of the TM, with a value of 1 within the edge of the TM and 0 outside the edge.
Figure 4
Figure 4
The displacement at one point near the umbo on the TM surface changing with stimulus phase computed from raw stroboscopic holographic data (dotted line with circle) and reconstructed from the Fourier analysis (solid line). The correlation between the raw displacement data and the Fourier reconstruction is very high (0.9942).
Figure 5
Figure 5
The displacement along one horizontal chord across the TM. The chord is positioned just below the umbo. The displacements are illustrated at eight stimulus phases for four sound stimuli: 92 dB SPL at 0.5 kHz, 90 dB SPL at 1 kHz, 103 dB SPL at 4 kHz and 115 dB SPL at 8 kHz. The x-axes show the approximate distance along the chord from a point just below the umbo (anterior = negative; posterior = positive). The location just below the umbo is marked on each panel by a thick solid line. The colored lines of different line type across the bottom of each panel code the stimulus phase associated with the largest outward motion at each location. When the maximal outward motion occurs at two different phases, two lines are shown. (A) At 0.5 kHz, the displacements of the TM along the chord at varied phases are of the largest magnitude in the posterior half of the TM and all of the points along the chord move with roughly the same phase. (B) At 1 kHz, the TM moves similarly as in 0.5 kHz, with the largest motion in the posterior site and all of the points along the chord moving with roughly the same phase. (C) At 4 kHz, the displacement pattern is more complex with multiple local maxima along the chord occurring at different stimulus phases. (D) At 8 kHz, the pattern of motion with time is more complicated with eight identifiable magnitude peaks.
Figure 6
Figure 6
Perspective (3D) plots of the instantaneous displacement (normalized by sound pressure) of the entire TM surface at eight stimulus phases for a stimulus frequency of 0.5 kHz. The color bars on the right side represent the normalized displacement value in µm/Pa. The orientation of the TM and the location of the umbo are shown in the first image at the stimulus phase 0. The entire TM is moving roughly in phase from (a) to (h), with two local peaks developing with time and marked by P1 and P2. The two peaks reach their maxima between 1/4 and 3/8 cycle of stimulus phase, with P2 somewhat later than P1.
Figure 7
Figure 7
Perspective plots of the instantaneous displacement (normalized by sound pressure) of the entire TM surface at eight instant stimulus phases for stimulus frequency of 4 kHz. The color bars on the right side represent the normalized displacement value in µm/Pa. The orientation of the TM and the location of the umbo are shown in the first image at the stimulus phase 0. About ten separate peaks are identified on the TM surface as shown in panel (a). Motion within some of the peaks occurs with different phases (panels c, d and e) and some peaks appear to move to different locations (panels d and e).
Figure 8
Figure 8
Perspective plots of the instantaneous displacement (normalized by sound pressure) of the entire TM surface at eight instant stimulus phases for stimulus frequency of 8 kHz. The color bars on the right side represent the normalized displacement value in µm/Pa. The orientation of the TM and the location of the umbo are shown in the first image at the stimulus phase 0.
Figure 9
Figure 9
Fourier derived displacement magnitude and phase of the TM along four diameters at 0°, 45°, 90° and 135° on the TM surface for the stimulus of 0.5 (Fig. 9A), 1 (Fig. 9B), 4 (Fig. 9C) and 8 (Figure 9D) kHz. The top panel of each figure shows the magnitude of the displacement in micrometers, the bottom panel of each figure shows the displacement phase in cycles. The cartoon in the bottom panel of Fig. 9A shows the orientation of the TM and the four diameters, which are illustrated by dotted lines that run through the umbo. The x-axis shows the approximate distance away from the umbo (at 0 mm) along the diameters. (A) At 0.5 kHz, the displacement magnitude along 0° and 45° diameters shows peaks in the posterior-superior quadrant of the TM, and smaller displacement magnitudes along the 90° and 135° diameters. The displacement phase is nearly identical along all four diameters. (B) At 1 kHz, the displacement amplitude and phase along four diameters are similar to those in Fig. 8A. The near half-cycle phase shifts near the edges of the TM are probably due to measurement noise. (C) At 4 kHz, the displacement amplitude shows multiple spatial maxima and minima along all four diameters, with significant phase variations along different diameters at different locations on the TM surface. (D) At 8 kHz, similar complex displacement patterns are seen along the four diameters on the TM surface, the displacement amplitude shows multiple spatial maxima and minima, while the displacement phase shows variations along the diameters at different locations.

Similar articles

Cited by

References

    1. Decraemer WF, Khanna SM, Funnell WR. Interferometric measurement of the amplitude and phase of tympanic membrane vibrations in cat. Hear Res. 1989;38(1–2):1–17. - PubMed
    1. Decraemer WF, Khanna SM, Funnell WR. Vibration at a fine grid of points on the cat tympanic membrane measured with a heterodyne interferometer. EOS/SPIE Int Sym, Munchen. 1999
    1. de La Rochefoucauld O, Olson E. A sum of simple and complex motions on the eardrum and manubrium in gerbil. Hearing Research MEMRO. 2009 - PMC - PubMed
    1. Fay J, Puria S, Decraemer WF, Steele C. Three approaches for estimating the elastic modulus of the tympanic membrane. J Biomech. 2005;38:1807–1815. - PubMed
    1. Fletcher NH. Acoustic Systems in Biology. New York: Oxford Univ. Press; 1992.

Publication types

MeSH terms