

Infragranular gene expression disturbances in the prefrontal cortex in schizophrenia: signature of altered neural development?
- PMID: 20034564
- PMCID: PMC2823856
- DOI: 10.1016/j.nbd.2009.12.013
Infragranular gene expression disturbances in the prefrontal cortex in schizophrenia: signature of altered neural development?
Abstract
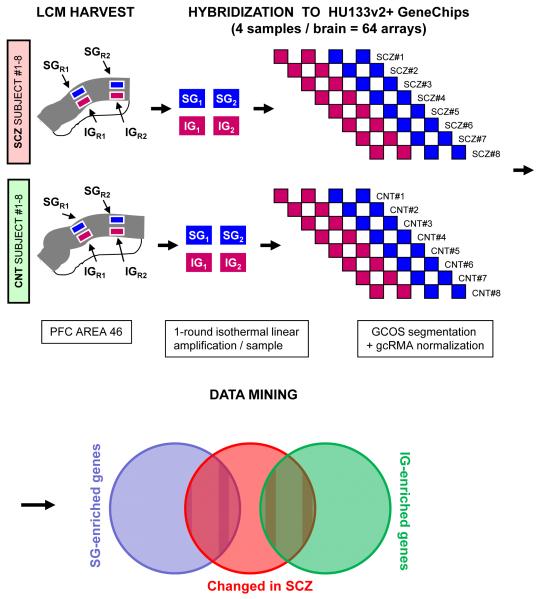
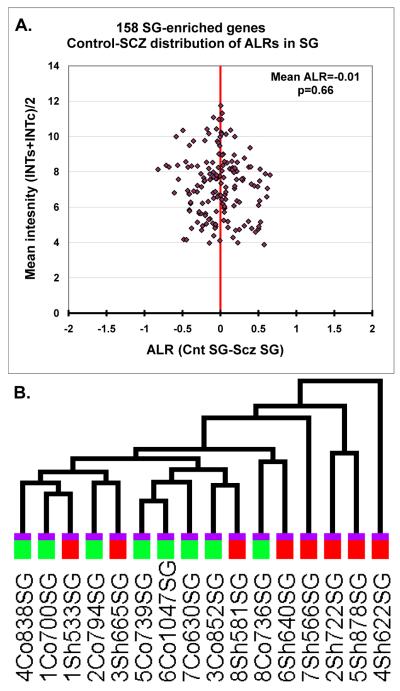
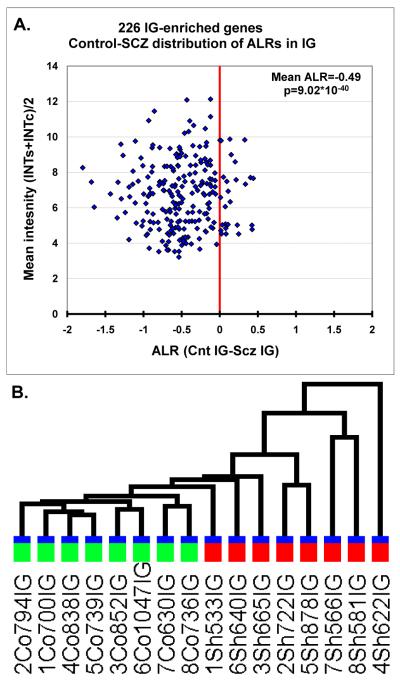
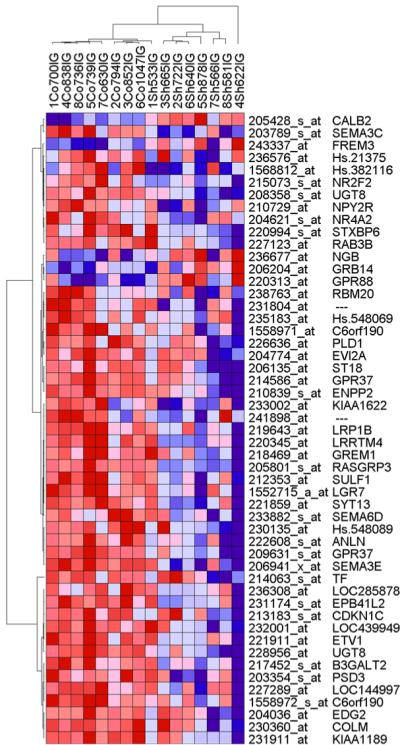
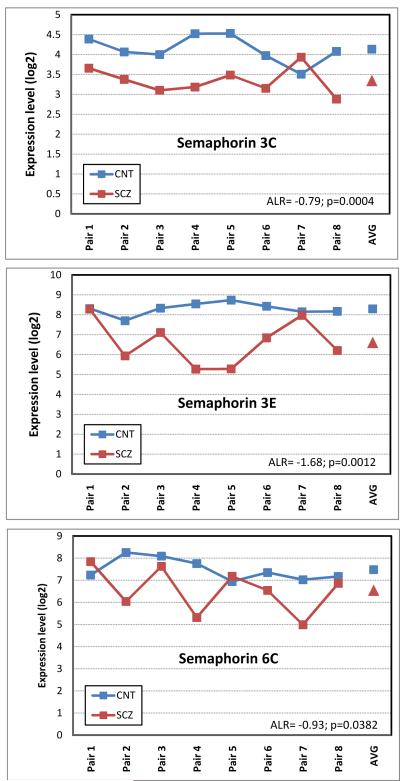
The development of the human neocortex gives rise to a complex cytoarchitecture, grouping together cells with similar structure, connectivity and function. As a result, the six neocortical laminae show distinct molecular content. In schizophrenia, many anatomical and neurochemical changes appear to be restricted to a subset of lamina and/or cell types. In this study, we hypothesized that supragranular (SG; laminae II-III) and infragranular layers (IG; laminae V-VI) of area 46 in the human prefrontal cortex will show distinct and specific transcriptome alterations between subjects with schizophrenia and matched controls. To enhance sample homogeneity, we compared the gene expression patterns of the SG and IG layers of 8 matched middle-aged male subjects with schizophrenia to 8 pairwise matched controls using two replicate DNA microarrays for each sample. The study revealed strong disease-related laminar expression differences between the SG and IG layers. Expression changes were dominated by an overall underexpression of the IG-enriched genes in the schizophrenia subjects compared to normal control subjects. Furthermore, using a diagnosis-blind, unsupervised clustering of the control-derived SG or IG-enriched transcripts, the IG-enriched markers segregated the subjects with schizophrenia from the matched controls with a high degree of confidence. Importantly, multiple members of the semaphorin gene family reported altered gene expression, suggesting that the IG gene expression disturbances in subjects with schizophrenia may be a result of altered cortical development and disrupted brain connectivity.
2009 Elsevier Inc. All rights reserved.
Figures
Similar articles
-
Molecular markers distinguishing supragranular and infragranular layers in the human prefrontal cortex.Eur J Neurosci. 2007 Mar;25(6):1843-54. doi: 10.1111/j.1460-9568.2007.05396.x. Eur J Neurosci. 2007. PMID: 17432970
-
Type III neuregulin-1 is required for normal sensorimotor gating, memory-related behaviors, and corticostriatal circuit components.J Neurosci. 2008 Jul 2;28(27):6872-83. doi: 10.1523/JNEUROSCI.1815-08.2008. J Neurosci. 2008. PMID: 18596162 Free PMC article.
-
Gene expression deficits in a subclass of GABA neurons in the prefrontal cortex of subjects with schizophrenia.J Neurosci. 2003 Jul 16;23(15):6315-26. doi: 10.1523/JNEUROSCI.23-15-06315.2003. J Neurosci. 2003. PMID: 12867516 Free PMC article.
-
Familial and developmental abnormalities of front lobe function and neurochemistry in schizophrenia.J Psychopharmacol. 1997;11(2):133-42. doi: 10.1177/026988119701100206. J Psychopharmacol. 1997. PMID: 9254279 Review.
-
Schizophrenia as a disorder of neurodevelopment.Annu Rev Neurosci. 2002;25:409-32. doi: 10.1146/annurev.neuro.25.112701.142754. Epub 2002 Mar 22. Annu Rev Neurosci. 2002. PMID: 12052915 Review.
Cited by
-
In Sickness and in Health: Perineuronal Nets and Synaptic Plasticity in Psychiatric Disorders.Neural Plast. 2016;2016:9847696. doi: 10.1155/2016/9847696. Epub 2015 Dec 29. Neural Plast. 2016. PMID: 26839720 Free PMC article. Review.
-
Distinctive transcriptome alterations of prefrontal pyramidal neurons in schizophrenia and schizoaffective disorder.Mol Psychiatry. 2015 Nov;20(11):1397-405. doi: 10.1038/mp.2014.171. Epub 2015 Jan 6. Mol Psychiatry. 2015. PMID: 25560755 Free PMC article.
-
Epigenetics and biomarkers in the staging of neuropsychiatric disorders.Neurotox Res. 2010 Nov;18(3-4):347-66. doi: 10.1007/s12640-010-9163-5. Epub 2010 Mar 17. Neurotox Res. 2010. PMID: 20237880 Review.
-
Deconvolution of transcriptional networks identifies TCF4 as a master regulator in schizophrenia.Sci Adv. 2019 Sep 11;5(9):eaau4139. doi: 10.1126/sciadv.aau4139. eCollection 2019 Sep. Sci Adv. 2019. PMID: 31535015 Free PMC article.
-
Segmentation of supragranular and infragranular layers in ultra-high-resolution 7T ex vivo MRI of the human cerebral cortex.Cereb Cortex. 2024 Sep 3;34(9):bhae362. doi: 10.1093/cercor/bhae362. Cereb Cortex. 2024. PMID: 39264753
References
-
- Akbarian S, Huang HS. Molecular and cellular mechanisms of altered GAD1/GAD67 expression in schizophrenia and related disorders. Brain Res Rev. 2006;52:293–304. - PubMed
-
- Akil M, et al. Lamina-specific alterations in the dopamine innervation of the prefrontal cortex in schizophrenic subjects. Am J Psychiatry. 1999;156:1580–9. - PubMed
-
- Angevine JJ, Sidman RL. Autoradiographic study of cell migration during histogenesis of cerebral cortex in the mouse. Nature. 1961;192:766–768. - PubMed
Publication types
MeSH terms
Substances
Grants and funding
LinkOut - more resources
Full Text Sources
Medical
Research Materials
