

Robust atrophy rate measurement in Alzheimer's disease using multi-site serial MRI: tissue-specific intensity normalization and parameter selection
- PMID: 20034579
- PMCID: PMC2828361
- DOI: 10.1016/j.neuroimage.2009.12.059
Robust atrophy rate measurement in Alzheimer's disease using multi-site serial MRI: tissue-specific intensity normalization and parameter selection
Abstract
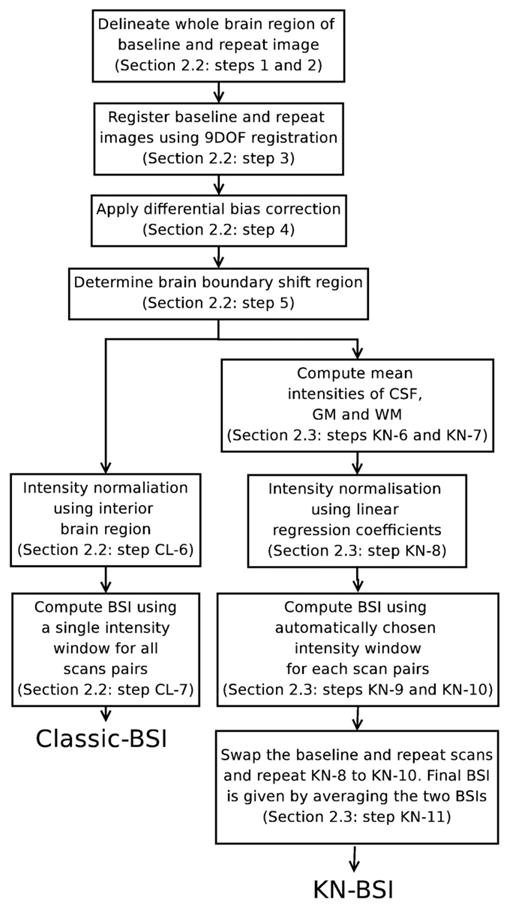
We describe an improved method of measuring brain atrophy rates from serial MRI for multi-site imaging studies of Alzheimer's disease (AD). The method (referred to as KN-BSI) improves an existing brain atrophy measurement technique-the boundary shift integral (classic-BSI), by performing tissue-specific intensity normalization and parameter selection. We applied KN-BSI to measure brain atrophy rates of 200 normal and 141 AD subjects using baseline and 1-year MRI scans downloaded from the Alzheimer's Disease Neuroimaging Initiative database. Baseline and repeat images were reviewed as pairs by expert raters and given quality scores. Including all image pairs, regardless of quality score, mean KN-BSI atrophy rates were 0.09% higher (95% CI 0.03% to 0.16%, p=0.007) than classic-BSI rates in controls and 0.07% higher (-0.01% to 0.16%, p=0.07) higher in ADs. The SD of the KN-BSI rates was 22% lower (15% to 29%, p<0.001) in controls and 13% lower (6% to 20%, p=0.001) in ADs, compared to classic-BSI. Using these results, the estimated sample size (needed per treatment arm) for a hypothetical trial of a treatment for AD (80% power, 5% significance to detect a 25% reduction in atrophy rate) would be reduced from 120 to 81 (a 32% reduction, 95% CI=18% to 45%, p<0.001) when using KN-BSI instead of classic-BSI. We concluded that KN-BSI offers more robust brain atrophy measurement than classic-BSI and substantially reduces sample sizes needed in clinical trials.
Keywords: Alzheimer’s disease; Atrophy; BSI; Boundary shift integral; Intensity normalization; KN-BSI; MRI.
Copyright 2010 Elsevier Inc. All rights reserved.
Figures
References
-
- Anderson VM, Fernando KTM, Davies GR, Rashid W, Frost C, Fox NC, Miller DH. Cerebral atrophy measurement in clinically isolated syndromes and relapsing remitting multiple sclerosis: a comparison of registration-based methods. J Neuroimaging. 2007 Jan;17 (1):61–68. - PubMed
-
- Barkhof F, Calabresi PA, Miller DH, Reingold SC. Imaging outcomes for neuroprotection and repair in multiple sclerosis trials. Nat Rev Neurol. 2009 May;5 (5):256–266. - PubMed
-
- Chan D, Fox NC, Jenkins R, Scahill RI, Crum WR, Rossor MN. Rates of global and regional cerebral atrophy in AD and frontotemporal dementia. Neurology. 2001 Nov;57 (10):1756–1763. - PubMed
-
- Christensen JD. Normalization of brain magnetic resonance images using histogram even-order derivative analysis. Magn Reson Imaging. 2003 Sep;21 (7):817–820. - PubMed
Publication types
MeSH terms
Grants and funding
LinkOut - more resources
Full Text Sources
Other Literature Sources
Medical
