

A PIP1 aquaporin contributes to hydrostatic pressure-induced water transport in both the root and rosette of Arabidopsis
- PMID: 20034965
- PMCID: PMC2832249
- DOI: 10.1104/pp.109.145326
A PIP1 aquaporin contributes to hydrostatic pressure-induced water transport in both the root and rosette of Arabidopsis
Abstract
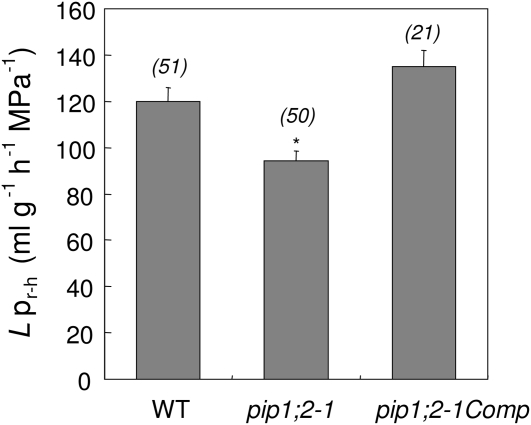
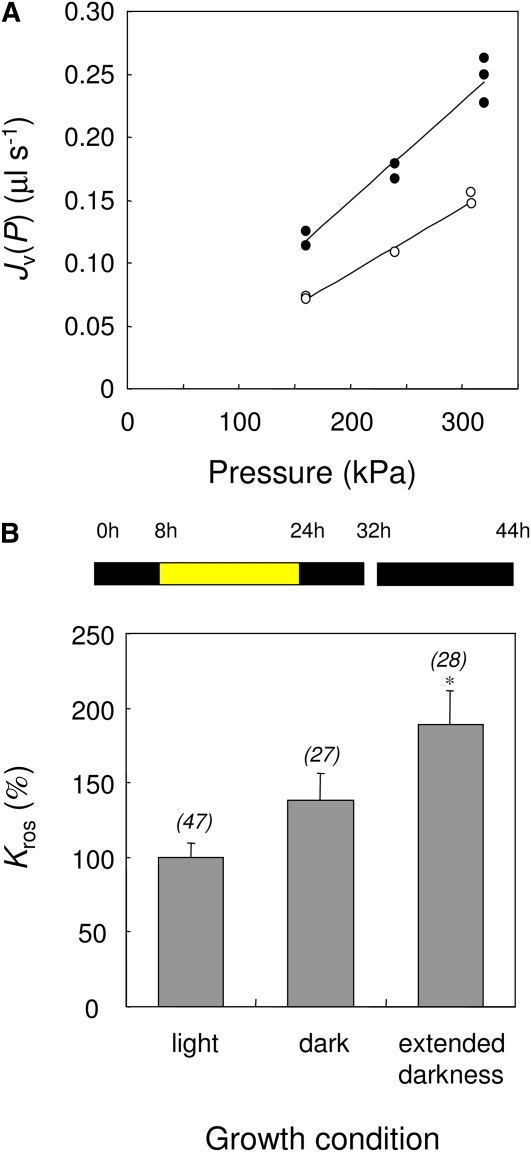
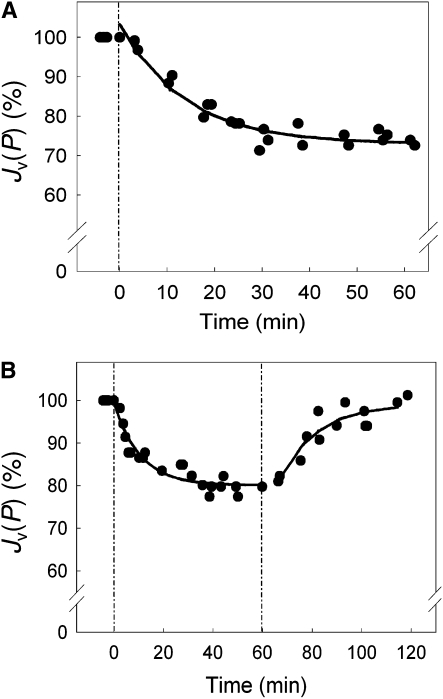
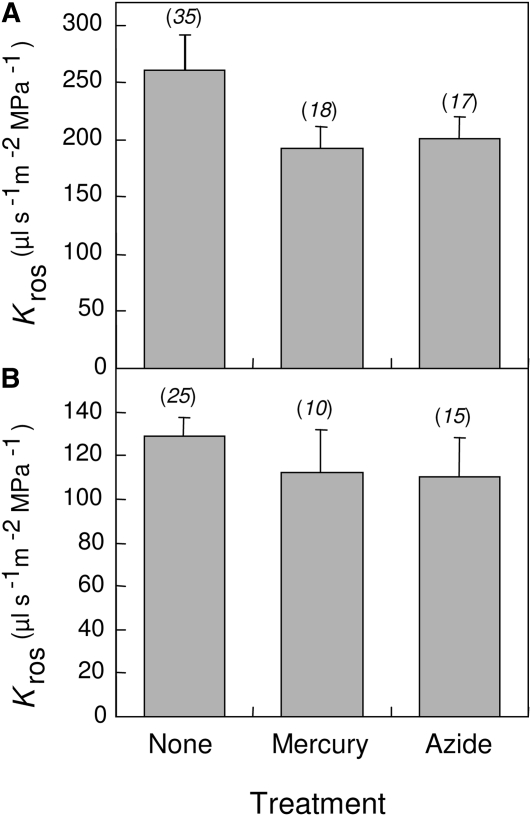
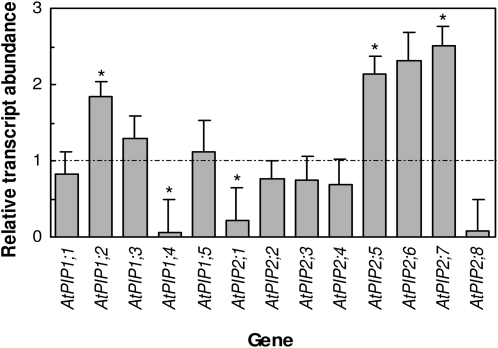
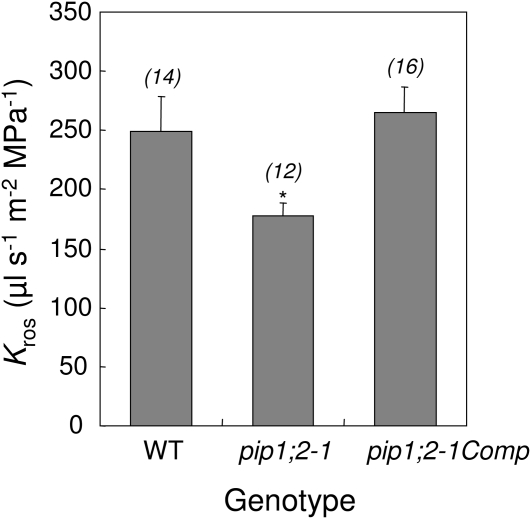
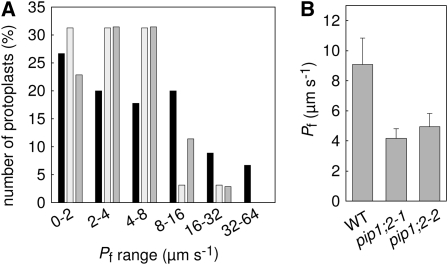
Aquaporins are channel proteins that facilitate the transport of water across plant cell membranes. In this work, we used a combination of pharmacological and reverse genetic approaches to investigate the overall significance of aquaporins for tissue water conductivity in Arabidopsis (Arabidopsis thaliana). We addressed the function in roots and leaves of AtPIP1;2, one of the most abundantly expressed isoforms of the plasma membrane intrinsic protein family. At variance with the water transport phenotype previously described in AtPIP2;2 knockout mutants, disruption of AtPIP1;2 reduced by 20% to 30% the root hydrostatic hydraulic conductivity but did not modify osmotic root water transport. These results document qualitatively distinct functions of different PIP isoforms in root water uptake. The hydraulic conductivity of excised rosettes (K(ros)) was measured by a novel pressure chamber technique. Exposure of Arabidopsis plants to darkness increased K(ros) by up to 90%. Mercury and azide, two aquaporin inhibitors with distinct modes of action, were able to induce similar inhibition of K(ros) by approximately 13% and approximately 25% in rosettes from plants grown in the light or under prolonged (11-18 h) darkness, respectively. Prolonged darkness enhanced the transcript abundance of several PIP genes, including AtPIP1;2. Mutant analysis showed that, under prolonged darkness conditions, AtPIP1;2 can contribute to up to approximately 20% of K(ros) and to the osmotic water permeability of isolated mesophyll protoplasts. Therefore, AtPIP1;2 can account for a significant portion of aquaporin-mediated leaf water transport. The overall work shows that AtPIP1;2 represents a key component of whole-plant hydraulics.
Figures
Similar articles
-
Regulation of Arabidopsis leaf hydraulics involves light-dependent phosphorylation of aquaporins in veins.Plant Cell. 2013 Mar;25(3):1029-39. doi: 10.1105/tpc.112.108456. Epub 2013 Mar 26. Plant Cell. 2013. PMID: 23532070 Free PMC article.
-
Early effects of salinity on water transport in Arabidopsis roots. Molecular and cellular features of aquaporin expression.Plant Physiol. 2005 Oct;139(2):790-805. doi: 10.1104/pp.105.065029. Epub 2005 Sep 23. Plant Physiol. 2005. PMID: 16183846 Free PMC article.
-
Coordinated post-translational responses of aquaporins to abiotic and nutritional stimuli in Arabidopsis roots.Mol Cell Proteomics. 2013 Dec;12(12):3886-97. doi: 10.1074/mcp.M113.028241. Epub 2013 Sep 20. Mol Cell Proteomics. 2013. PMID: 24056735 Free PMC article.
-
The role of aquaporins in root water uptake.Ann Bot. 2002 Sep;90(3):301-13. doi: 10.1093/aob/mcf199. Ann Bot. 2002. PMID: 12234142 Free PMC article. Review.
-
Aquaporins: highly regulated channels controlling plant water relations.Plant Physiol. 2014 Apr;164(4):1600-18. doi: 10.1104/pp.113.233791. Epub 2014 Jan 21. Plant Physiol. 2014. PMID: 24449709 Free PMC article. Review.
Cited by
-
Burning questions for a warming and changing world: 15 unknowns in plant abiotic stress.Plant Cell. 2023 Jan 2;35(1):67-108. doi: 10.1093/plcell/koac263. Plant Cell. 2023. PMID: 36018271 Free PMC article.
-
RNA-seq analysis of short fiber mutants Ligon-lintless-1 (Li 1 ) and - 2 (Li 2 ) revealed important role of aquaporins in cotton (Gossypium hirsutum L.) fiber elongation.BMC Plant Biol. 2015 Feb 27;15:65. doi: 10.1186/s12870-015-0454-0. BMC Plant Biol. 2015. PMID: 25848981 Free PMC article.
-
Salinity-mediated transcriptional and post-translational regulation of the Arabidopsis aquaporin PIP2;7.Plant Mol Biol. 2016 Dec;92(6):731-744. doi: 10.1007/s11103-016-0542-z. Epub 2016 Sep 26. Plant Mol Biol. 2016. PMID: 27671160
-
Ectopic Expression of a Thellungiella salsuginea Aquaporin Gene, TsPIP1;1, Increased the Salt Tolerance of Rice.Int J Mol Sci. 2018 Jul 30;19(8):2229. doi: 10.3390/ijms19082229. Int J Mol Sci. 2018. PMID: 30061546 Free PMC article.
-
New insights into the salt-responsive regulation in eelgrass at transcriptional and post-transcriptional levels.Front Plant Sci. 2025 Feb 6;16:1497064. doi: 10.3389/fpls.2025.1497064. eCollection 2025. Front Plant Sci. 2025. PMID: 39980478 Free PMC article.
References
-
- Aasamaa K, Sober A. (2005) Seasonal courses of maximum hydraulic conductance in shoots of six temperate deciduous tree species. Funct Plant Biol 32: 1077–1087 - PubMed
-
- Alexandersson E, Fraysse L, Sjovall-Larsen S, Gustavsson S, Fellert M, Karlsson M, Johanson U, Kjellbom P. (2005) Whole gene family expression and drought stress regulation of aquaporins. Plant Mol Biol 59: 469–484 - PubMed
-
- Alonso JM, Stepanova AN, Leisse TJ, Kim CJ, Chen H, Shinn P, Stevenson DK, Zimmerman J, Barajas P, Cheuk R, et al. (2003) Genome-wide insertional mutagenesis of Arabidopsis thaliana. Science 301: 653–657 - PubMed
Publication types
MeSH terms
Substances
LinkOut - more resources
Full Text Sources
Molecular Biology Databases
