

Continuous estimates of dynamic cerebral autoregulation during transient hypocapnia and hypercapnia
- PMID: 20035062
- PMCID: PMC2838633
- DOI: 10.1152/japplphysiol.01157.2009
Continuous estimates of dynamic cerebral autoregulation during transient hypocapnia and hypercapnia
Abstract
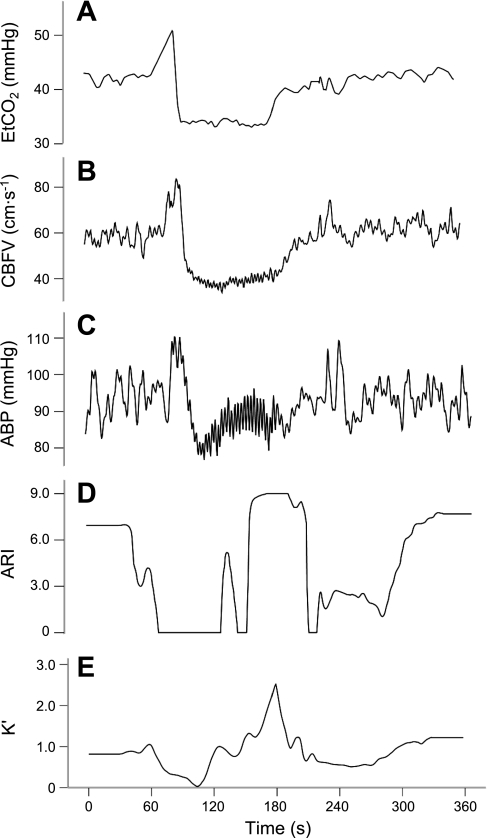
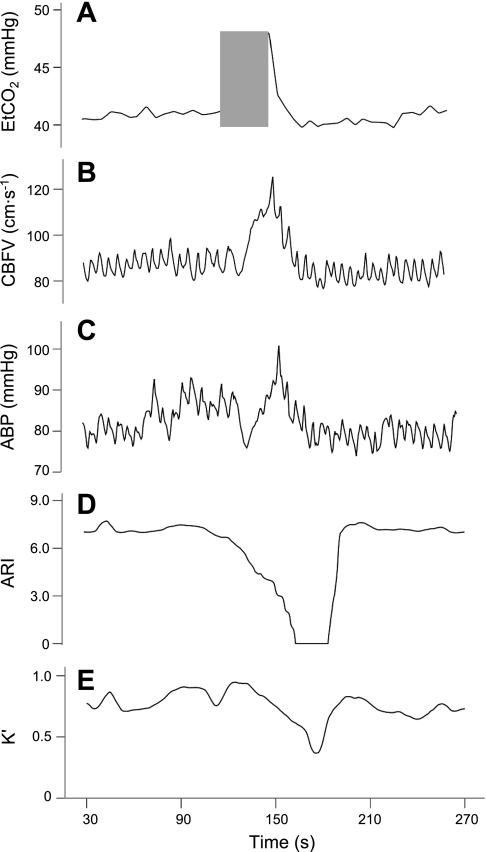
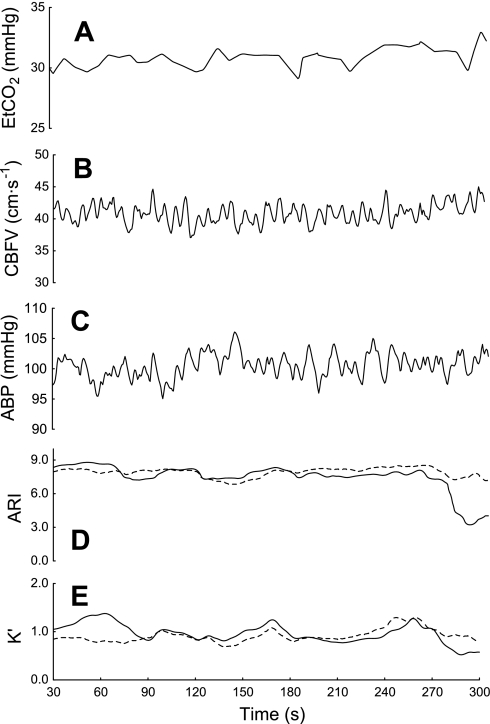
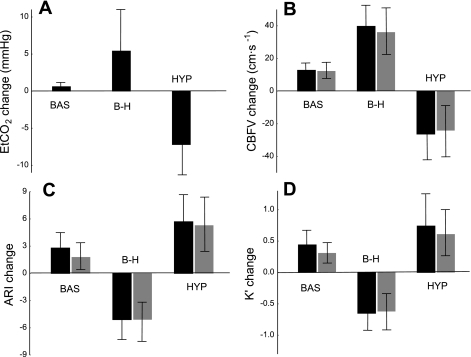
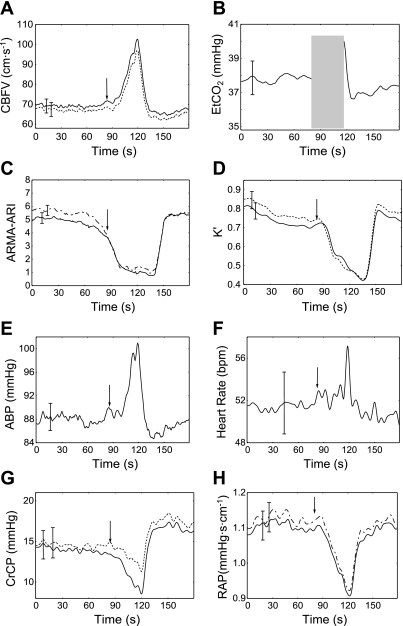
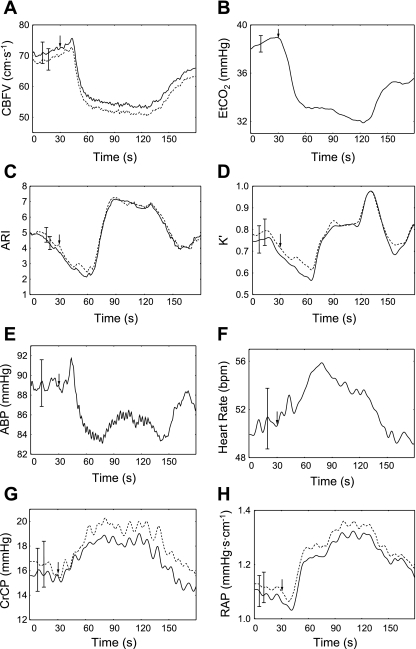
Dynamic cerebral autoregulation (CA) is the transient response of cerebral blood flow (CBF) to rapid blood pressure changes: it improves in hypocapnia and becomes impaired during hypercapnia. Batch-processing techniques have mostly been used to measure CA, providing a single estimate for an entire recording. A new approach to increase the temporal resolution of dynamic CA parameters was applied to transient hypercapnia and hypocapnia to describe the time-varying properties of dynamic CA during these conditions. Thirty healthy subjects (mean +/- SD: 25 +/- 6 yr, 9 men) were recruited. CBF velocity was recorded in both middle cerebral arteries (MCAs) with transcranial Doppler ultrasound. Arterial blood pressure (Finapres), end-tidal CO(2) (ET(CO(2)); infrared capnograph), and a three-lead ECG were also measured at rest and during repeated breath hold and hyperventilation. A moving window autoregressive moving average model provided continuous values of the dynamic CA index [autoregulation index (ARI)] and unconstrained gain. Breath hold led to significant increase in ET(CO(2)) (+5.4 +/- 6.1 mmHg), with concomitant increase in CBF velocity in both MCAs. Continuous dynamic CA parameters showed highly significant changes (P < 0.001), with a temporal pattern reflecting a delayed dynamic response of CA to changes in arterial Pco(2) and a maximal reduction in ARI of -5.1 +/- 2.4 and -5.1 +/- 2.3 for the right and left MCA, respectively. Hyperventilation led to a marked decrease in ET(CO(2)) (-7.2 +/- 4.1 mmHg, P < 0.001). Unexpectedly, CA efficiency dropped significantly with the inception of the metronome-controlled hyperventilation, but, after approximately 30 s, the ARI increased gradually to show a maximum change of 5.7 +/- 2.9 and 5.3 +/- 3.0 for the right and left MCA, respectively (P < 0.001). These results confirm the potential of continuous estimates of dynamic CA to improve our understanding of human cerebrovascular physiology and represent a promising new approach to improve the sensitivity of clinical applications of dynamic CA modeling.
Figures
Similar articles
-
Spontaneous fluctuations in cerebral blood flow regulation: contribution of PaCO2.J Appl Physiol (1985). 2010 Dec;109(6):1860-8. doi: 10.1152/japplphysiol.00857.2010. Epub 2010 Sep 30. J Appl Physiol (1985). 2010. PMID: 20884837
-
Effects of ageing on cerebral haemodynamics assessed during respiratory manoeuvres.Age Ageing. 2011 Mar;40(2):199-204. doi: 10.1093/ageing/afq170. Epub 2011 Jan 27. Age Ageing. 2011. PMID: 21273209 Clinical Trial.
-
Assessment of middle cerebral artery diameter during hypocapnia and hypercapnia in humans using ultra-high-field MRI.J Appl Physiol (1985). 2014 Nov 15;117(10):1084-9. doi: 10.1152/japplphysiol.00651.2014. Epub 2014 Sep 4. J Appl Physiol (1985). 2014. PMID: 25190741
-
Hyperventilation, cerebral perfusion, and syncope.J Appl Physiol (1985). 2014 Apr 1;116(7):844-51. doi: 10.1152/japplphysiol.00637.2013. Epub 2013 Nov 21. J Appl Physiol (1985). 2014. PMID: 24265279 Review.
-
The effect of burst suppression on cerebral blood flow and autoregulation: a scoping review of the human and animal literature.Front Physiol. 2023 Jun 7;14:1204874. doi: 10.3389/fphys.2023.1204874. eCollection 2023. Front Physiol. 2023. PMID: 37351255 Free PMC article.
Cited by
-
Critical Closing Pressure and Cerebrovascular Resistance Responses to Intracranial Pressure Variations in Neurocritical Patients.Neurocrit Care. 2023 Oct;39(2):399-410. doi: 10.1007/s12028-023-01691-8. Epub 2023 Mar 3. Neurocrit Care. 2023. PMID: 36869208 Free PMC article.
-
Parametric transfer function analysis and modeling of blood flow autoregulation in the optic nerve head.Int J Physiol Pathophysiol Pharmacol. 2014 Mar 13;6(1):13-22. eCollection 2014. Int J Physiol Pathophysiol Pharmacol. 2014. PMID: 24665355 Free PMC article.
-
Hypercapnia Impairs Vasoreactivity to Changes in Blood Pressure and Intraocular Pressure in Rat Retina.Optom Vis Sci. 2019 Jul;96(7):470-476. doi: 10.1097/OPX.0000000000001400. Optom Vis Sci. 2019. PMID: 31274734 Free PMC article.
-
Determining differences between critical closing pressure and resistance-area product: responses of the healthy young and old to hypocapnia.Pflugers Arch. 2019 Aug;471(8):1117-1126. doi: 10.1007/s00424-019-02290-3. Epub 2019 Jun 15. Pflugers Arch. 2019. PMID: 31203426
-
Influence of CO2 on neurovascular coupling: interaction with dynamic cerebral autoregulation and cerebrovascular reactivity.Physiol Rep. 2014 Mar 27;2(3):e00280. doi: 10.1002/phy2.280. Print 2014. Physiol Rep. 2014. PMID: 24760531 Free PMC article.
References
-
- Aaslid R, Lindegaard KF, Sorteberg W, Nornes H. Cerebral autoregulation dynamics in humans. Stroke 20: 45–52, 1989 - PubMed
-
- Ainslie PN, Celi L, McGrattan K, Peebles K, Ogoh S. Dynamic cerebral autoregulation and baroreflex sensitivity during modest and severe step changes in arterial pCO2. Brain Res 1230: 115–124, 2008 - PubMed
-
- Brodie FG, Atkins ER, Robinson TG, Panerai RB. Reliability of dynamic cerebral autoregulation measurements using spontaneous fluctuations in blood pressure. Clin Sci 116: 513–520, 2009 - PubMed
-
- Chacon M, Nunez N, Henriquez C, Panerai RB. Unconstrained parameter estimation for assessment of dynamic cerebral autoregulation. Physiol Meas 29: 1179–1193, 2008 - PubMed
-
- Dora E, Kovach AGB. Metabolic and vascular volume oscillations in the cat brain cortex. Acta Physiol Acad Scient Hung 57: 261–275, 1981 - PubMed
MeSH terms
LinkOut - more resources
Full Text Sources