

Three-dimensional surface maps link local atrophy and fast ripples in human epileptic hippocampus
- PMID: 20035513
- PMCID: PMC3299311
- DOI: 10.1002/ana.21703
Three-dimensional surface maps link local atrophy and fast ripples in human epileptic hippocampus
Abstract
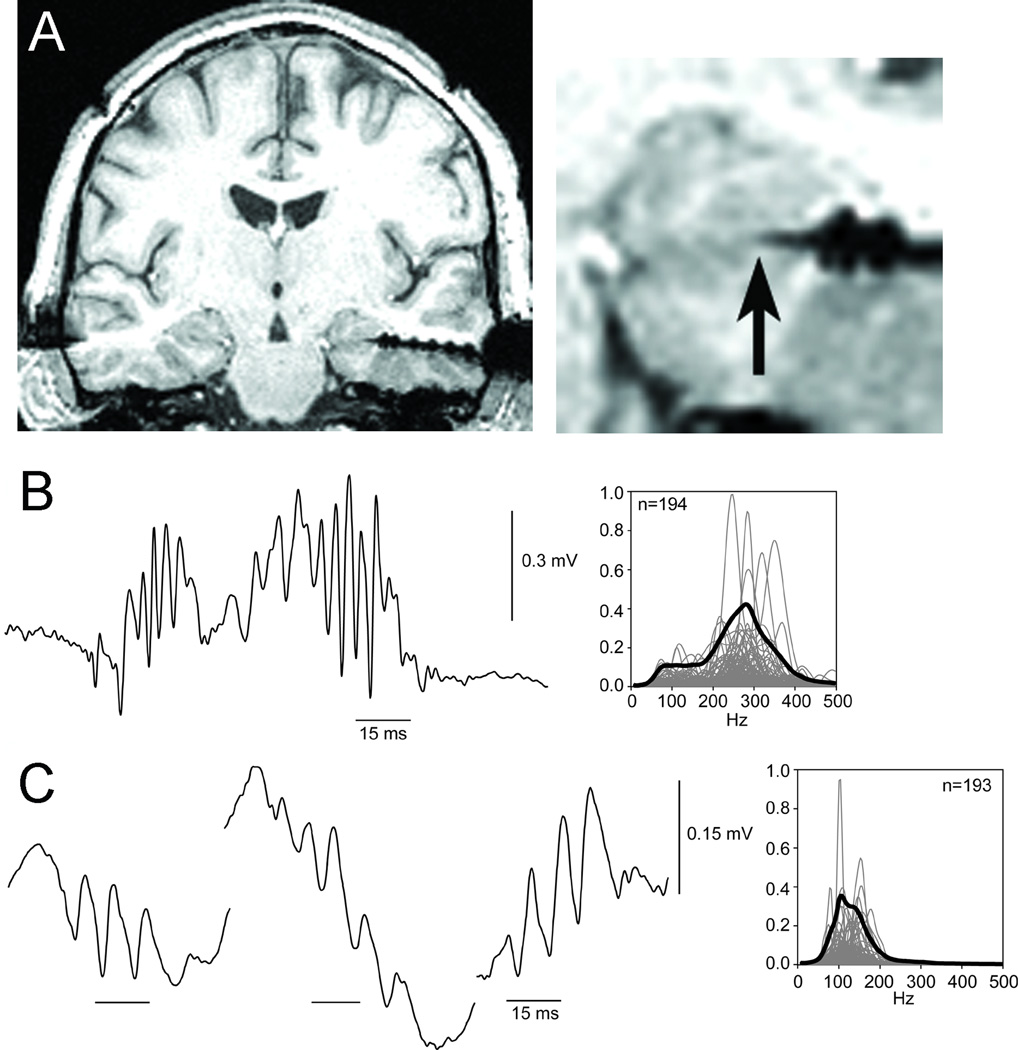
Objectives: There is compelling evidence that pathological high-frequency oscillations (HFOs), called fast ripples (FR, 150-500Hz), reflect abnormal synchronous neuronal discharges in areas responsible for seizure genesis in patients with mesial temporal lobe epilepsy (MTLE). It is hypothesized that morphological changes associated with hippocampal atrophy (HA) contribute to the generation of FR, yet there is limited evidence that hippocampal FR-generating sites correspond with local areas of atrophy.
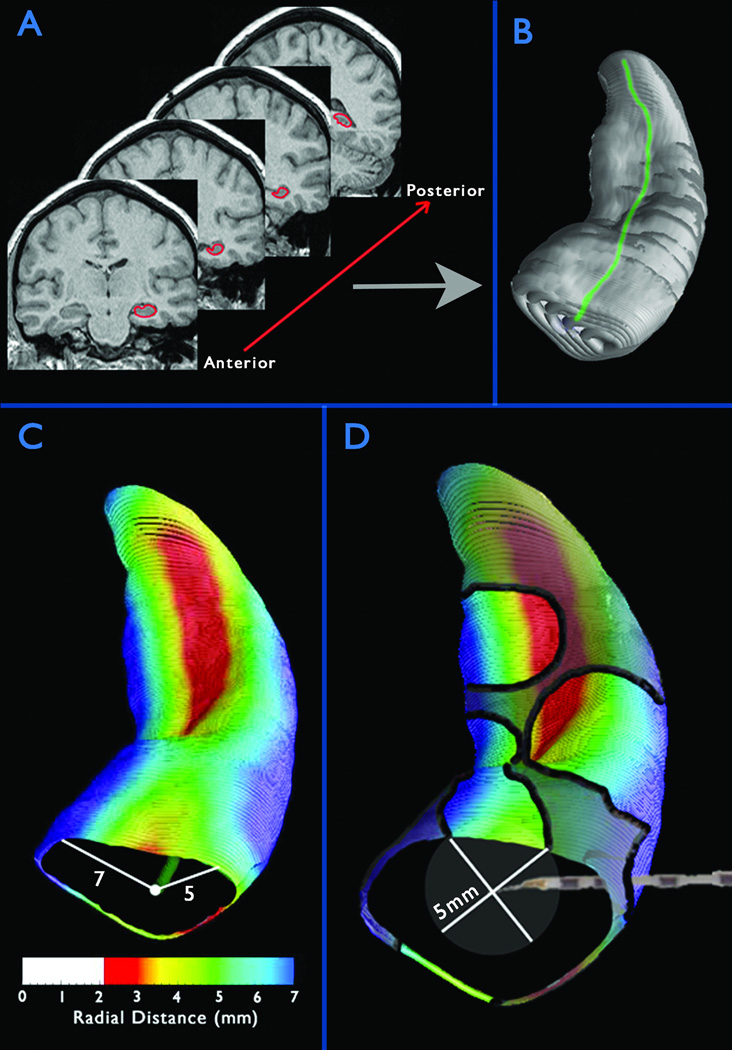
Methods: Interictal HFOs were recorded from hippocampal microelectrodes in 10 patients with MTLE. Rates of FR and ripple discharge from each microelectrode were evaluated in relation to local measures of HA obtained using 3-dimensional magnetic resonance imaging (MRI) hippocampal modeling.
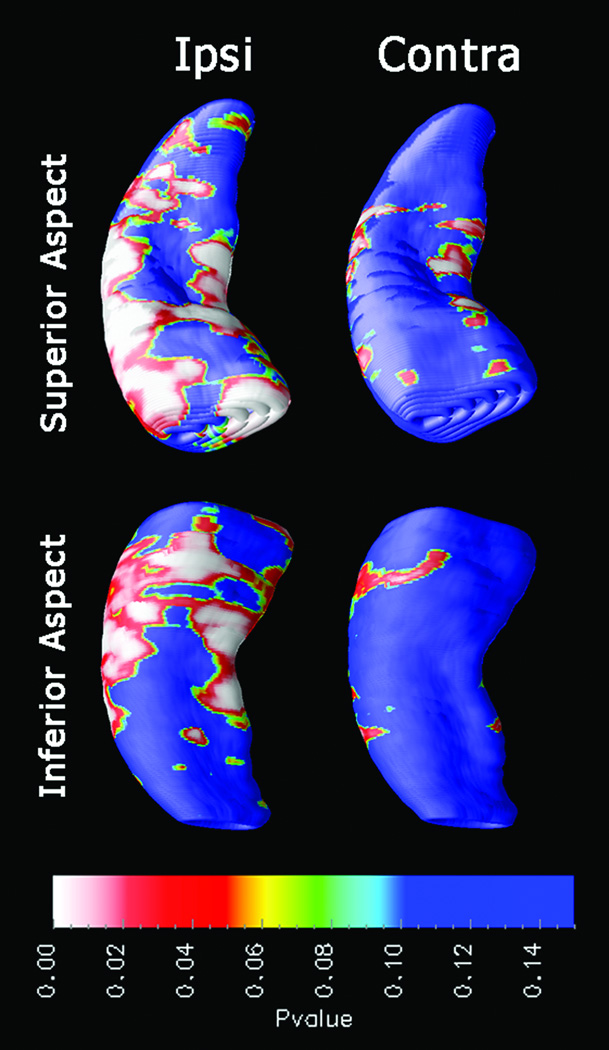
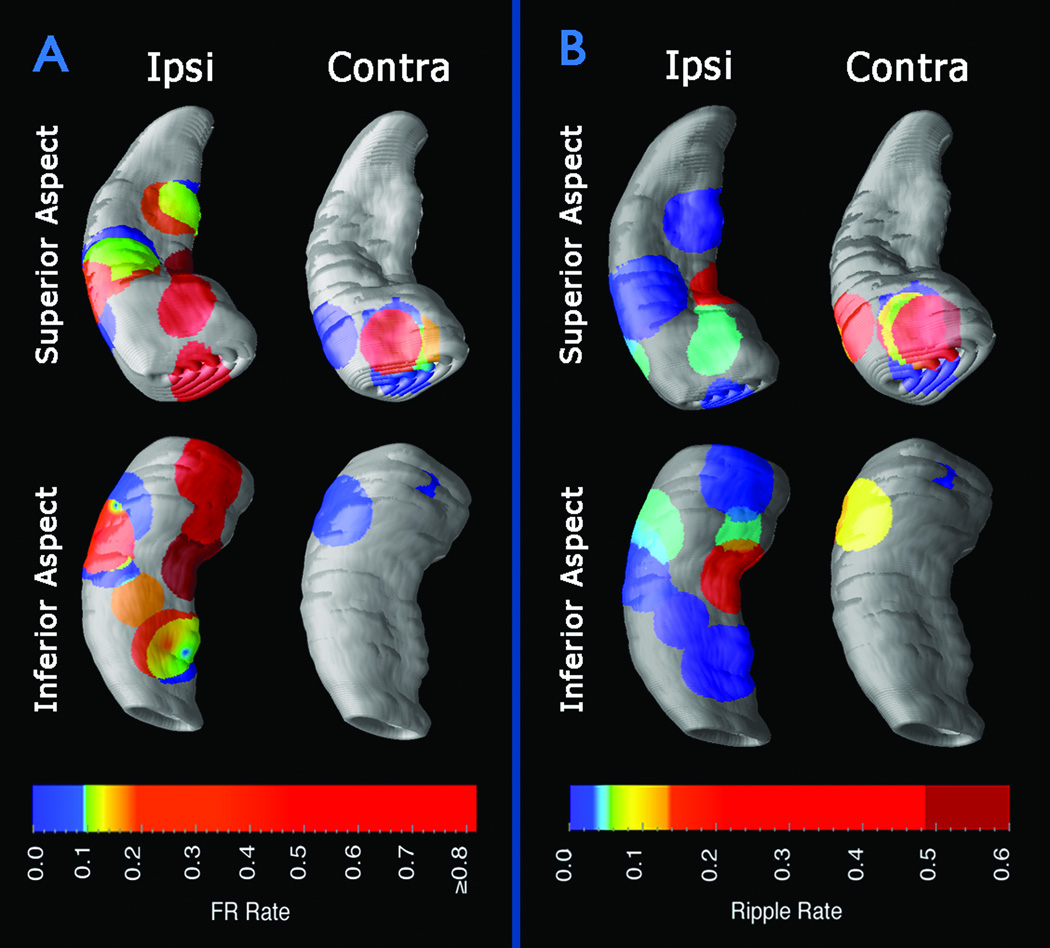
Results: Rates of FR discharge were 3 times higher in areas of significant local HA compared with rates in nonatrophic areas. Furthermore, FR occurrence correlated directly with the severity of damage in these local atrophic regions. In contrast, we found no difference in rates of ripple discharge between local atrophic and nonatrophic areas.
Interpretation: The proximity between local HA and microelectrode-recorded FR suggests that morphological changes such as neuron loss and synaptic reorganization may contribute to the generation of FR. Pathological HFOs, such as FR, may provide a reliable surrogate marker of abnormal neuronal excitability in hippocampal areas responsible for the generation of spontaneous seizures in patients with MTLE. Based on these data, it is possible that MRI-based measures of local HA could identify FR-generating regions, and thus provide a noninvasive means to localize epileptogenic regions in hippocampus.
Conflict of interest statement
Figures
Similar articles
-
Increased fast ripple to ripple ratios correlate with reduced hippocampal volumes and neuron loss in temporal lobe epilepsy patients.Epilepsia. 2007 Nov;48(11):2130-8. doi: 10.1111/j.1528-1167.2007.01225.x. Epub 2007 Jul 28. Epilepsia. 2007. PMID: 17662059
-
Hippocampal high frequency oscillations in unilateral and bilateral mesial temporal lobe epilepsy.Clin Neurophysiol. 2019 Jul;130(7):1151-1159. doi: 10.1016/j.clinph.2019.03.026. Epub 2019 Apr 10. Clin Neurophysiol. 2019. PMID: 31100580
-
Quantitative analysis of high-frequency oscillations (80-500 Hz) recorded in human epileptic hippocampus and entorhinal cortex.J Neurophysiol. 2002 Oct;88(4):1743-52. doi: 10.1152/jn.2002.88.4.1743. J Neurophysiol. 2002. PMID: 12364503
-
Clinical correlations with hippocampal atrophy.Magn Reson Imaging. 1995;13(8):1133-6. doi: 10.1016/0730-725x(95)02023-m. Magn Reson Imaging. 1995. PMID: 8750327 Review.
-
High-frequency oscillations and mesial temporal lobe epilepsy.Neurosci Lett. 2018 Feb 22;667:66-74. doi: 10.1016/j.neulet.2017.01.047. Epub 2017 Jan 20. Neurosci Lett. 2018. PMID: 28115239 Review.
Cited by
-
Phase-amplitude coupling between interictal high-frequency activity and slow waves in epilepsy surgery.Epilepsia. 2018 Oct;59(10):1954-1965. doi: 10.1111/epi.14544. Epub 2018 Aug 26. Epilepsia. 2018. PMID: 30146766 Free PMC article.
-
Evolution of temporal and spectral dynamics of pathologic high-frequency oscillations (pHFOs) during epileptogenesis.Epilepsia. 2015 Dec;56(12):1879-89. doi: 10.1111/epi.13218. Epub 2015 Oct 30. Epilepsia. 2015. PMID: 26514993 Free PMC article.
-
Gray matter loss correlates with mesial temporal lobe neuronal hyperexcitability inside the human seizure-onset zone.Epilepsia. 2012 Jan;53(1):25-34. doi: 10.1111/j.1528-1167.2011.03333.x. Epub 2011 Nov 29. Epilepsia. 2012. PMID: 22126325 Free PMC article.
-
Two seizure-onset types reveal specific patterns of high-frequency oscillations in a model of temporal lobe epilepsy.J Neurosci. 2012 Sep 19;32(38):13264-72. doi: 10.1523/JNEUROSCI.5086-11.2012. J Neurosci. 2012. PMID: 22993442 Free PMC article.
-
High-frequency oscillations in epileptic brain.Curr Opin Neurol. 2010 Apr;23(2):151-6. doi: 10.1097/WCO.0b013e3283373ac8. Curr Opin Neurol. 2010. PMID: 20160649 Free PMC article. Review.
References
-
- O'Keefe J, Nadel L. The hippocampus as a cognitive map. Oxford: Clarendon Press; 1978.
-
- Suzuki SS, Smith GK. Spontaneous EEG spikes in the normal hippocampus. II. Relations to synchronous burst discharges. Electroencephalogr Clin Neurophysiol. 1988;69:532–540. - PubMed
-
- Buzsaki G, Horvath Z, Urioste R, et al. High-frequency network oscillation in the hippocampus. Science. 1992;256:1025–1027. - PubMed
-
- Bragin A, Engel J, Jr, Wilson CL, et al. High-frequency oscillations in human brain. Hippocampus. 1999;9:137–142. - PubMed
-
- Bragin A, Engel J, Jr, Wilson CL, et al. Electrophysiologic analysis of a chronic seizure model after unilateral hippocampal KA injection. Epilepsia. 1999;40:1210–1221. - PubMed
Publication types
MeSH terms
Grants and funding
LinkOut - more resources
Full Text Sources
