. 2010 Feb 10;28(6):1620-34.
doi: 10.1016/j.vaccine.2009.11.014. Epub 2009 Dec 23.

A detailed characterisation of the distribution and presentation of DNA vaccine encoded antigen

Affiliations

A detailed characterisation of the distribution and presentation of DNA vaccine encoded antigen

Catherine M Rush et al. Vaccine. .

Abstract

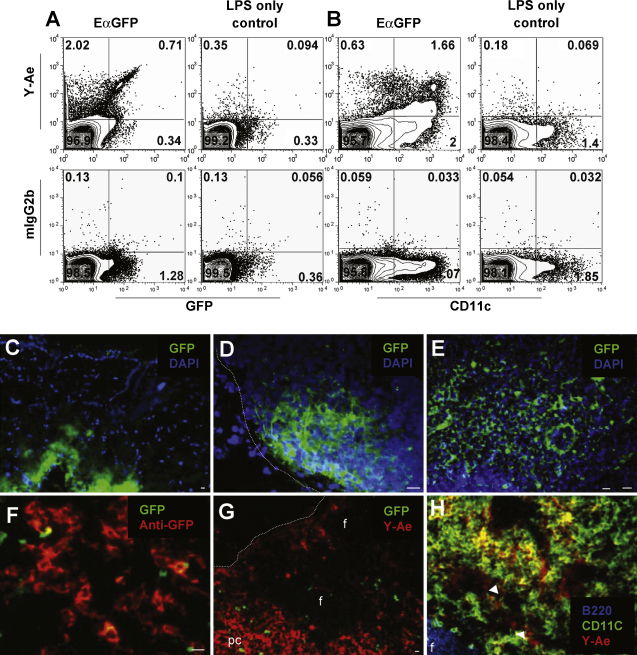
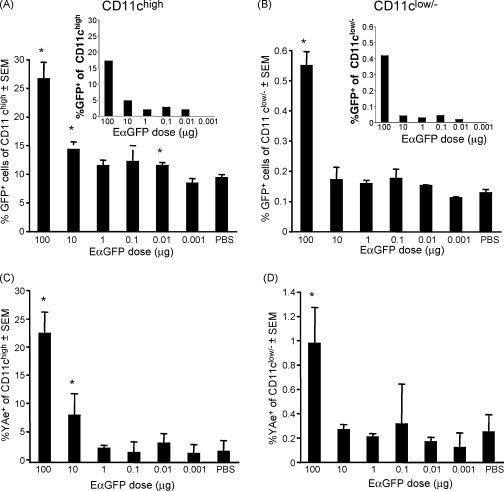
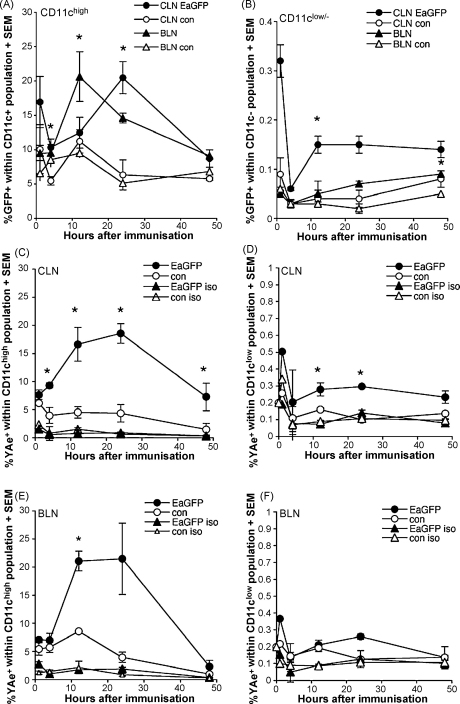
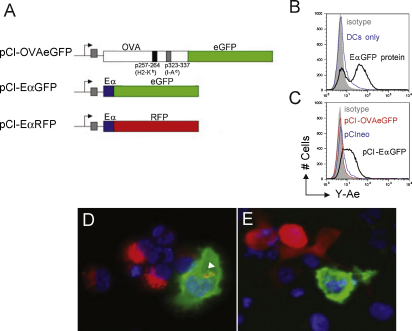
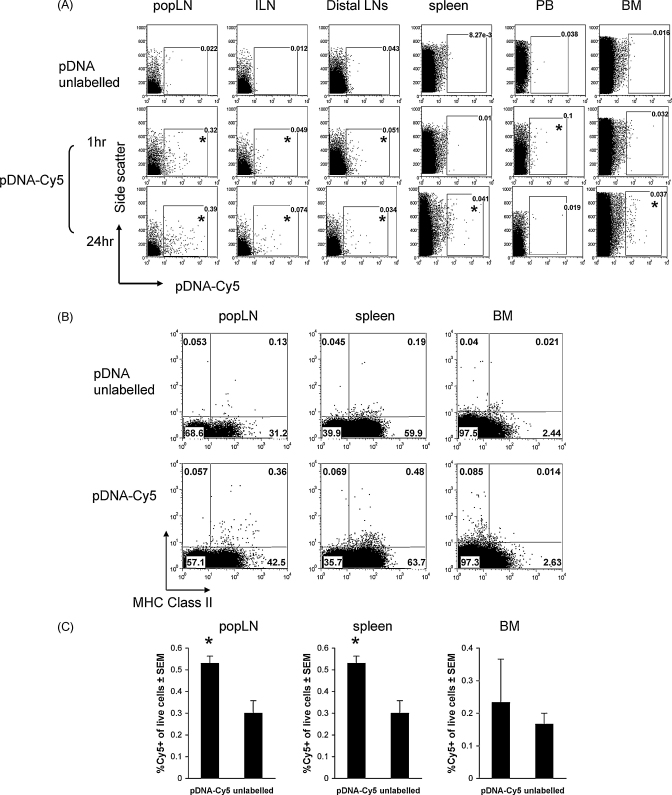
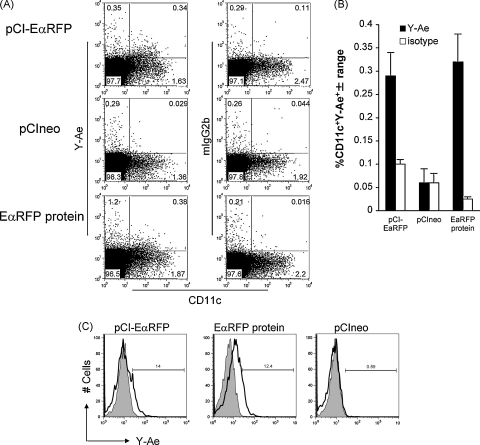
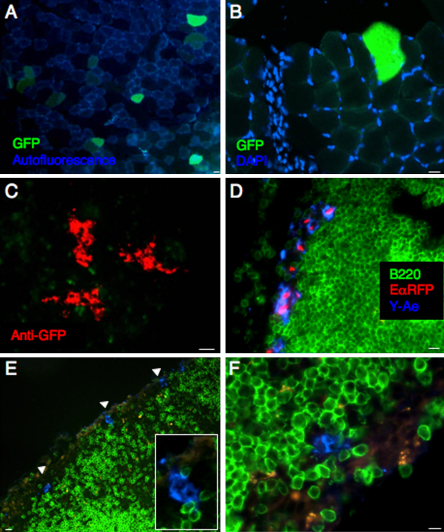
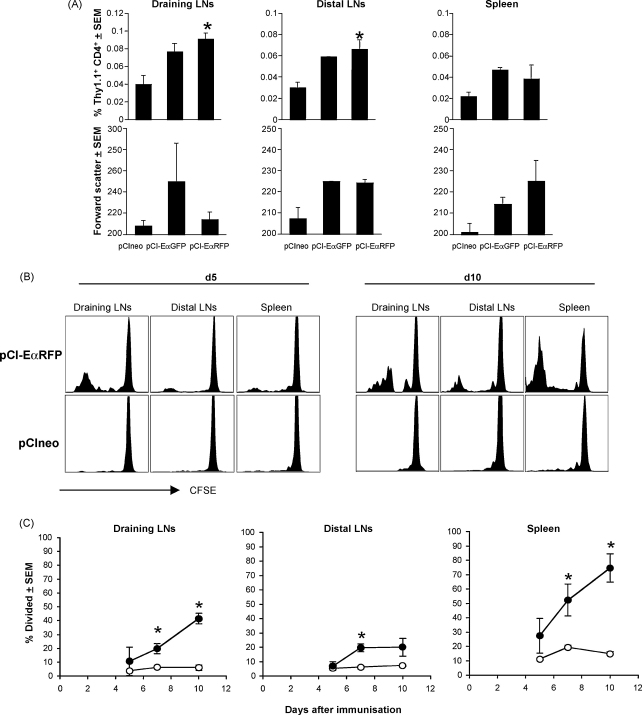
The association between plasmid DNA distribution, the amount of Ag produced, Ag persistence and the identity and localisation of cells presenting DNA-encoded Ag all have important consequences for both quantitative and qualitative aspects of T cell responses induced by DNA vaccines. Using a variety of approaches to detect and quantify the uptake of injected DNA, and the production and presentation of DNA-encoded antigen, we report that injected DNA vaccines rapidly enter the peripheral blood from the injection site and also reach muscle-draining lymph nodes directly as free DNA. 24h after plasmid injection, MHCII(+)CD11b(+)B220(-)CD11c(low/-) cells in the draining and distal LNs and spleen contain pDNA. Interestingly, we also observed pDNA(+)MHCII(low/-)CD11b(+) within the bone marrow. Concomitantly, we detected Ag-containing/expressing cells at both the injection site and in draining lymph nodes. Three days after plasmid injection we detected rare pMHC(+)CD11c(+) cells within secondary lymphoid tissue and simultaneously observed Ag-specific CD4(+) T cell accumulation and blastogenesis in these tissues. Our results show that the events that determine the induction of DNA vaccine immune responses occur within days of DNA injection and that the response becomes systemic very rapidly, possibly with involvement from resident BM cells.


Figures

Fig. 1
Fig. 1
Ag and pMHC complexes were detected in draining lymph nodes following EαGFP immunisation. 24 h after EαGFP injection, flow cytometry was used to assess the proportion of live cells in pooled draining CLNs and BLNs that were GFP+, pMHC+ (i.e. Y-Ae+) and CD11c+ (A and B). Control mice received LPS only. Mouse IgG2b was used as Y-Ae isotype control for each sample and was used to set positive and negative quadrant gates. Representative dot plots are shown for each group (n = 3). Fluorescence microscopy was used to demonstrate EαGFP (green) in tissue sections of the injection site (C) and in draining CLNs (D and E), 30 min after protein injection. The intrinsic GFP signal was amplified using a GFP-specific polyclonal Ab (red in F). At 24 h post-injection, large areas of the paracortex (pc) of DLNs were Y-Ae+ (G), whereas B cell follicle areas (f) were not stained. Phenotypic characterisation using lineage specific Abs (H) showed that many Y-Ae+ cells were also CD11c+ (yellow), although some Y-Ae+ cells did not costain with CD11c (red, indicated by arrows). (H) Fluorochromes were false coloured to improve colour contrast. Dotted lines indicate the periphery of LNs. Representative data is shown. Scale bars show approximately 10 μm. (For interpretation of the references to colour in this figure legend, the reader is referred to the web version of the article.)
Fig. 2
Fig. 2
Dose-related detection of GFP-containing and pMHC+ cells in peripheral lymph nodes 24 h after Ag injection. Different doses of EαGFP Ag (100 μg, 1 μg, 0.1 μg, 0.01 μg, 0.001 μg) each containing 1 μg LPS were administered by subcutaneous injection in the neck scruff. Mice immunised with PBS containing 1 μg LPS were used for controls to establish the baseline staining and assay sensitivity. Draining proximal CLNs and BLNs were collected at 24 h from individual mice. The proportion of GFP+ cells in gated CD11chigh (A) and CD11clow/− (B) populations was determined for each sample by flow cytometry and results expressed as group mean percentage ± standard error of the mean (SEM). The high proportion of apparently GFP+ CD11c+ cells in the PBS/LPS control (∼10–15%) is due to background autofluorescence in the CD11c+ gate resulting from the collection of the large numbers of cells needed for analysis of the small fraction (1–4%) of lymph node CD11c+ cells. If the mean autofluorescence of the PBS control group is subtracted (insets in A and B) from the mean percentage of the groups receiving 0.001–100 μg EαGFP, it is clear that GFP+ cells are found in draining LNs for all antigen doses ranging from 100 μg to 10 ng. The proportion of CD11chigh and CD11clow/− cells displaying pMHC complexes is shown in (C) and (D), respectively. Mouse IgG2b was used as the Y-Ae isotype control for each sample and used to set positive and negative gates. Error bars show SEM for each group, where n = 3. Statistical comparisons (Students’ unpaired t-test, 2 way, assuming unequal variance) were made between the PBS control group and each dose and asterisk (*) indicates statistical significance where p < 0.05.
Fig. 3
Fig. 3
Kinetics of appearance of EαGFP and pMHC positive cells in lymph nodes draining the injection site. Flow cytometry was used to assess the proportion of CD11chigh and CD11clow/− cells carrying EαGFP (A and B) and displaying pMHC complexes (C–F) at 1 h, 4 h, 12 h, 24 h and 48 h after EαGFP/LPS injection. Cell suspensions were prepared from the CLNs and BLNs of mice receiving either 100 μg EαGFP/LPS or PBS/LPS alone. Live cells were gated for CD11c expression and CD11chigh and CD11clow/− gated cells were analysed separately for both GFP and Y-Ae staining. The mean percentage of CD11c+ cells in CLNs (closed circles, ●) and BLNs (closed triangles, ▴), that are GFP+ at each timepoint, are shown in (A). Open circles (○) and open triangles (▵) represent background staining in CLNs and BLNs of control mice receiving PBS/LPS only. Results for CD11clow/− cells are shown in (B). The mean percentage of CD11c+ cells in CLNs, at each timepoint, that are surface Y-Ae+ following EαGFP (●) or PBS/LPS control immunisation (○) are shown in (C). Mouse IgG2b was used as the Y-Ae isotype control to set positive and negative gates and is represented as open symbols in (C). (D) Results for Y-Ae staining in CD11clow/− cells. Kinetic results for CD11chigh and CD11clow/− cells in BLN are shown in (E) and (F), respectively. Statistical comparisons were made between the EαGFP/LPS group (n = 3) and control PBS/LPS group (n = 3) for each timepoint and asterisk (*) indicates significance where p < 0.05 using the Student's t-test. Error bars show standard error of the means (SEM).
Fig. 4
Fig. 4
DNA vaccine expression constructs used in this study. (A) Constructs were all based on the pCIneo (Promega). pCI-CytOVAeGFP encodes a cytosolic form of an OVAeGFP fusion protein for simultaneous detection of OVA and eGFP in vivo. pCI-EαGFP encodes the EαGFP fusion protein described above and is used for identifying cells expressing (GFP) and presenting (Eα) the Ag EαGFP. pCI-EαRFP is similar to pEαGFP except for the substitution of RFP. (B–E) In vitro Ag presentation assay to demonstrate that plasmid-expressed EαGFP and EαRFP is processed and the Eα peptide displayed on the surface of APCs in vitro. HeLa cells were transfected with the plasmid constructs pCIneo, pCI-OVAeGFP, pCI-EαGFP, or pCI-EαRFP and B6 bone marrow DCs (+LPS) were added and cells were co-cultured for 24 h to allow DCs to acquire, process and display plasmid-expressed Ag. For positive controls, HeLa/DC co-cultures were pulsed with EαGFP or EαRFP protein. Cells were harvested, stained for CD11c and pMHC complexes using Y-Ae or isotype control (mIgG2b) and analysed by flow cytometry. (B) DCs pulsed with EαGFP were Y-Ae+ (surface Eα peptide:MHC ClassII complex) (black), whereas both unpulsed DCs (blue) and isotype controls (grey shading) show minimal staining. (C) Y-Ae+ DCs were only present when DCs were co-cultured with pCI-EαGFP-transfectants (black) but not with pCIneo (blue) nor pCI-CytOVAeGFP (red) control transfectants. Isotype controls showed little staining (grey shading). Flow cytometry results for pCI-EαRFP were similar to those for pCI-EαGFP and are not shown. (D) Immunofluorescence staining of cytospins of EαRFP protein-pulsed HeLa/DCs shows, EαRFP-containing monocytic cells (red) with a larger dendritic-like cell also staining with Y-Ae mAb (green). Intact EαRFP Ag is also visible within the Y-Ae+ cell (indicated by arrow). (E) Y-Ae+ cells are also present in pCI-EαRFP-transfected HeLa/DC cultures (green). A transfected HeLa cell (red) can be seen adjacent to the Y-Ae+ cell. (For interpretation of the references to colour in this figure legend, the reader is referred to the web version of the article.)
Fig. 5
Fig. 5
pDNA distribution and phenotype of pDNA-containing cells following plasmid injection. (A) Tissues including the TA muscle, draining popliteal (popLN) and inguinal lymph nodes (ILN), distal brachial and cervical lymph nodes (distal LNs), spleen, peripheral blood and bone marrow were collected 1 h and 24 h following intramuscular injection of Cy5-labelled (pDNA-Cy5) or unlabelled control pDNA. Cell suspensions were examined for the presence pDNA-Cy5 by flow cytometry. Live cell gates (determined by forward and side scatter characteristics) were drawn and cell suspensions from mice receiving unlabelled pDNA were used to set cutoffs for positive and negative gates and represented background tissue staining. Cy5 fluorescence was assessed using the FL4 channel of the FACScalibur and cells with above background fluorescence were considered positive. (A) Cy5 fluorescence (X-axis) vs. side scatter (Y-axis) for representative samples from various tissues at 2 different timepoints. At 1 h we observed pDNA-Cy5 in popliteal, inguinal and distal peripheral lymph nodes with largest numbers in the local muscle-draining popliteal LN. We also observed a few pDNA-Cy5+ cells in peripheral blood, but none were detected in either spleen or bone marrow. Asterisk (*) indicates tissues with Cy5+ cells. At 24 h post-pDNA-Cy5 injection we found Cy5+-cells in draining and distal peripheral lymph nodes. The popliteal LN contained the highest percentage of positive cells. Although we were unable to find pDNA-containing cells in the peripheral blood at 24 h, we were able to demonstrate positive cells in both the spleen and BM. Further characterisation of cell suspensions from pDNA-Cy5 immunised mice shown that pDNA-Cy5+ cells from the popLN and spleen were MHCII+, whereas those from BM were predominantly MHCII (B). Statistical comparisons (Students’ unpaired t-test, 2 way, assuming unequal variance) were made between the percentage of Cy5+-live cells in pDNA-Cy5 injected mice and background staining from unlabelled mice. (C) The mean percentage of Cy5+ cells in popLN, spleen and BM. Asterisk (*) indicates statistical significance where p < 0.05 (n = 3).
Fig. 6
Fig. 6
Detection of pMHC complexes in lymphoid tissue following DNA injection. (A) Flow cytometric analysis of pooled peripheral lymph nodes collected 3 days after pCI-EαRFP injection, revealed a small population of Y-Ae+CD11c+ cells (upper right quadrant), representing approximately 0.3% of live cells. pCIneo-immunised mice and isotype (mIgG2b) controls showed only background staining (0.03% and 0.11%, respectively). The proportion of Y-Ae+CD11c+ cells in pCI-EαRFP-immunised mice (i.e. 0.34%) is comparable to that seen 3 days after immunisation with EαRFP protein, i.e. several days after the peak of pMHC complex display. pCIneo-immunised mice and isotype (mIgG2b) controls showed only background staining (typically <0.1%). Results from one experiment (n = 2) are shown in (B) and other experiments (n = 3) showed a similar trend. The percentage of Y-Ae+CD11c+ cells is higher in pCI-EαRFP-immunised mice compared to both pCIneo-immunised mice and for isotype control staining. Analysis of CD11c+ gated cells (C) showed that approximately 14% and 12% of CD11c+ cells were also Y-Ae+ for pCI-EαRFP and EαRFP protein, respectively. Although the percentage of CD11c+ cells displaying pMHC was similar, the pattern of Y-Ae expression was quite different. We observed a shift in Y-Ae expression for the entire population following EαRFP protein immunisation, relative to its’ isotype control, whereas only a discrete population was positive following pCI-EαRFP injection. There was little change in Y-Ae expression following pCIneo immunisation.
Fig. 7
Fig. 7
Detection of Ag and pMHC complexes in tissue sections of pDNA-immunised mice. At different times after injection of pCI-EαRFP, pCI-EαGFP or pCIneo, we collected and processed TA muscle and draining and distal lymph nodes for immunofluorescence microscopy. GFP expression was observed at the muscle injection site, 24 h after pDNA injection (A and B). GFP+ muscle cells were predominantly found in the vicinity of the injection site, as evidenced by the inflammatory infiltrate at the needle trajectory (B). DAPI was used in (A) and (B) to stain cell nuclei. (C) Using anti-GFP IgG, we observed small clusters of GFP protein in draining popliteal LNs at 24 h post-injection (red). (D) We observed Y-Ae+ cells in the subcapsular sinus of EαRFP protein-immunised mice at 24 h (blue) and (E and F) in pCI-EαRFP-immunised mice at d3 post-plasmid injection (blue). No staining was observed in pCIneo-immunised mice or using the isotype control, mIgG2b (data not shown). Scale bars show 10 μm. (For interpretation of the references to colour in this figure legend, the reader is referred to the web version of the article.)
Fig. 8
Fig. 8
pDNA induces CD4 T cell proliferative responses early after intramuscular immunisation. To readout Ag presentation to CD4+ T cells in vivo, we transferred CFSE-labelled Eα-specific TEa T cells into B6 recipients and analysed the kinetics of T cell activation and cell division following injection with Eα-expressing plasmids. Mice that had received CFSE-labelled TEa Tg T cells 1 day previously, were immunised with pCI-EαRFP, pCI-EαGFP or the control plasmid pCIneo. Draining lymph nodes (popliteal and inguinal), distal peripheral lymph nodes (cervical, brachial and axial) and the spleen were collected at different times after immunisation (12 h–10 days) and analysed by flow cytometry for blastogenesis, clonal expansion and division of Tg lymphocytes. (A) At d3 post-immunisation we observed an increase in both the percentage and blastogenesis of Eα-specific Tg T cells in draining LNs (pooled popliteal and inguinal), distal peripheral LNs and the spleens of pCI-EαRFP- and pCI-EαGFP-immunised mice. No such increases were observed in the pCIneo group. (B and C) We observed division of TEa T cells in draining and distal lymph nodes and spleen at d5, d7 and d10 post-immunisation following injection with pCI-EαRFP but not the control plasmid pCIneo. Kinetic analysis of cell division (C) revealed that by day 5 post-pCI-EαRFP immunisation Eα-specific lymphocytes in the popLN and spleen had started to divide, and this number had increased by days 7 and 10. In contrast Eα-specific lymphocytes in distal lymph nodes has increased in number by day 7, but no further increased was observed at day 10. Cells from pCIneo-immunised mice showed only background staining at all timepoints. Error bars show standards errors and asterisk (*) indicates statistical significance compared to pCIneo-immunised group.

Similar articles

Cited by

References

    1. Itano A.A., McSorley S.J., Reinhardt R.L., Ehst B.D., Ingulli E., Rudensky A.Y. Distinct dendritic cell populations sequentially present antigen to CD4 T cells and stimulate different aspects of cell-mediated immunity. Immunity. 2003;19(1):47–57. - PubMed
    1. Rees W., Bender J., Teague T.K., Kedl R.M., Crawford F., Marrack P. An inverse relationship between T cell receptor affinity and antigen dose during CD4(+) T cell responses in vivo and in vitro. Proc Natl Acad Sci USA. 1999;96(17):9781–9786. - PMC - PubMed
    1. Rudensky A., Rath S., Preston-Hurlburt P., Murphy D.B., Janeway C.A., Jr. On the complexity of self. Nature. 1991;353(6345):660–662. - PubMed
    1. Hou S., Hyland L., Ryan K.W., Portner A., Doherty P.C. Virus-specific CD8+ T-cell memory determined by clonal burst size. Nature. 1994;369(6482):652–654. - PubMed
    1. Cho T.H., Chang S.H., Jan Y.S. Dose-dependent selective priming of Th1 and Th2 immune responses is achieved only by an antigen with an affinity over a certain threshold level. Mol Cells. 2000;10(6):695–704. - PubMed

Publication types

MeSH terms