. 2010 Feb;83(2):183-90.
doi: 10.1016/j.beproc.2009.12.013. Epub 2009 Dec 24.

Rhesus monkeys (Macaca mulatta) show robust primacy and recency in memory for lists from small, but not large, image sets

Affiliations

Rhesus monkeys (Macaca mulatta) show robust primacy and recency in memory for lists from small, but not large, image sets

Benjamin M Basile et al. Behav Processes. 2010 Feb.

Abstract

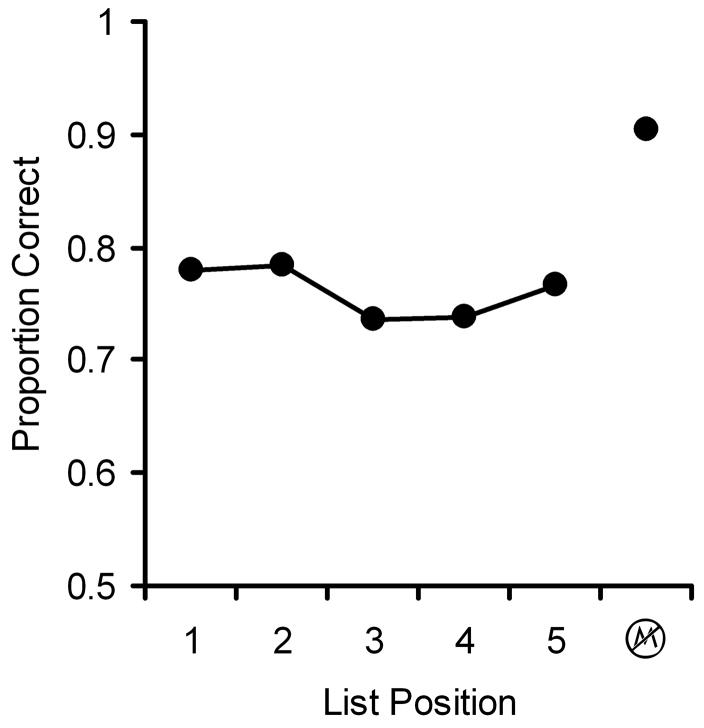
The combination of primacy and recency produces a U-shaped serial position curve typical of memory for lists. In humans, primacy is often thought to result from rehearsal, but there is little evidence for rehearsal in nonhumans. To further evaluate the possibility that rehearsal contributes to primacy in monkeys, we compared memory for lists of familiar stimuli (which may be easier to rehearse) to memory for unfamiliar stimuli (which are likely difficult to rehearse). Six rhesus monkeys saw lists of five images drawn from either large, medium, or small image sets. After presentation of each list, memory for one item was assessed using a serial probe recognition test. Across four experiments, we found robust primacy and recency with lists drawn from small and medium, but not large, image sets. This finding is consistent with the idea that familiar items are easier to rehearse and that rehearsal contributes to primacy, warranting further study of the possibility of rehearsal in monkeys. However, alternative interpretations are also viable and are discussed.


Figures

Figure 1
Figure 1
Schematic of the progression of events in the serial probe recognition trials used in Experiment 1. Monkeys touched the green start box to initiate a trial (leftmost panel), touched each of the five list images in sequence, experienced a delay, and then were presented with a test (rightmost panel). The test screen displayed a “non-match” symbol and an image that was either from the studied list or not. If the image was from the list, touching it was rewarded. If the image was not from the list, touching the “non match” symbol was rewarded. A black screen lasting 200 milliseconds separated images in the list during study.
Figure 2
Figure 2
Serial position curves for lists drawn from large (black dots), medium (gray dots), and small (white dots) sets of images in Experiment 1. Curves are pictured for delays of 0.2, 0.5, 2, and 10 seconds combined (leftmost panel) and for each of those delays separately (right four panels). Accuracy at 50 second delay not shown because accuracy did not vary as a function of list position for lists from any set size, see Table 1 for more information. Each dot represents proportion correct for tests with images from the given list position or tests on non-match trials. First and last list positions depicted as an asterisk indicate significant primacy and recency, respectively.
Figure 3
Figure 3
Serial position curves for lists drawn from large (black dots), medium (gray dots), and small (white dots) sets of images in Experiment 2, in which lists from all set sizes were intermixed. Left: Serial position curves for all six subjects. Right: Serial position curves for five subjects, excluding monkey Cy, whose extreme scores most contributed to the appearance of a serial position curve for lists from the large set. Curves are pictured for delays of 0.2, 0.5, 2, and 10 seconds combined. Each dot represents proportion correct for tests with images from the given list position or tests on non-match trials. First and last list positions depicted as an asterisk indicate significant primacy and recency, respectively.
Figure 4
Figure 4
Serial position curves for lists drawn from large (black dots), medium (gray dots), and small (white dots) sets of images in Experiment 3, in which study time was controlled. Curves are pictured for delays of 0.2, 0.5, 2, and 10 seconds combined. Each dot represents proportion correct for tests with images from the given list position or tests on non-match trials. First and last list positions depicted as an asterisk indicate significant primacy and recency, respectively.
Figure 5
Figure 5
Serial position curves for lists drawn from a large set of images in Experiment 4, in which study time was 100 milliseconds. The pictured curve is for delays of 0.2, 0.5, 2, and 10 seconds combined. Each dot represents proportion correct for tests with images from the given list position or tests on non-match trials.

References

    1. Aron A, Aron E. Statistics for psychology. Upper Saddle River, NJ: Prentice Hall; 1999.
    1. Atkinson RC, Shiffrin RM. Human memory: A proposed system and its control processes. In: Spence KW, Spence JT, editors. The Psychology of Learning and Motivation: Advances in Research and Theory. Vol. 2. New York: Academic Press; 1968. pp. 89–195.
    1. Baddeley A. Working Memory. Science. 1992;255(5044):556–559. - PubMed
    1. Baddeley AD, Hitch G. The Recency Effect - Implicit Learning with Explicit Retrieval. Memory & Cognition. 1993;21(2):146–155. - PubMed
    1. Baddeley AD, Warrington EK. Amnesia and Distinction between Long-and Short-Term Memory. Journal of Verbal Learning and Verbal Behavior. 1970;9(2):176.

Publication types