

Tempol ameliorates murine viral encephalomyelitis by preserving the blood-brain barrier, reducing viral load, and lessening inflammation
- PMID: 20035861
- PMCID: PMC7126783
- DOI: 10.1016/j.freeradbiomed.2009.12.013
Tempol ameliorates murine viral encephalomyelitis by preserving the blood-brain barrier, reducing viral load, and lessening inflammation
Abstract
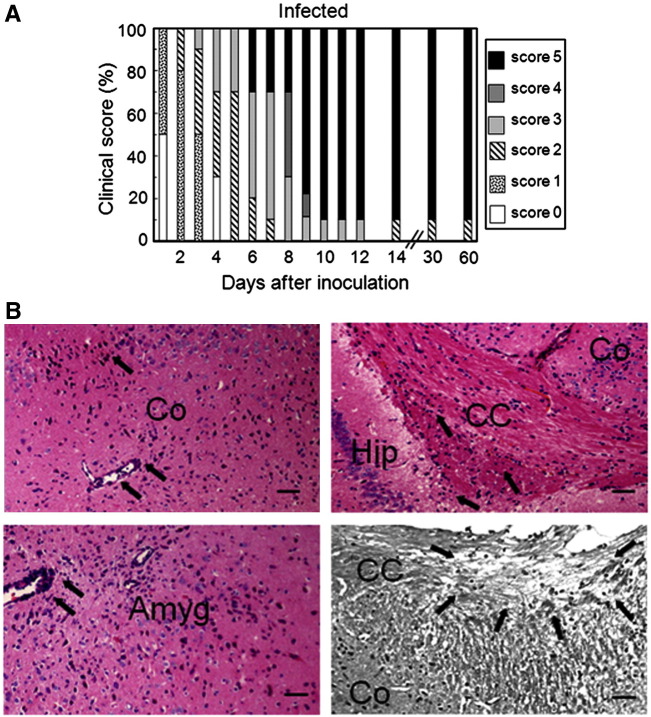
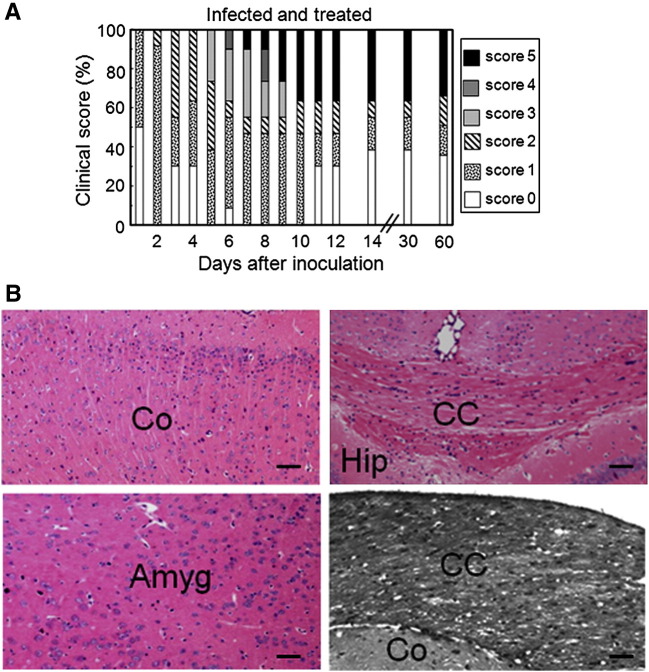
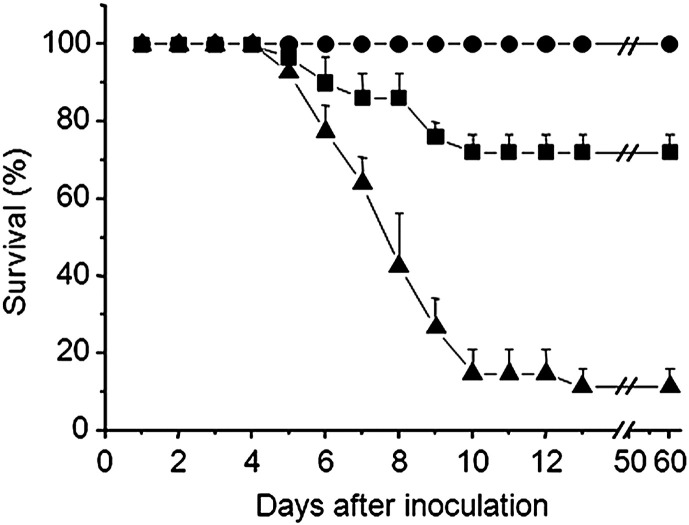
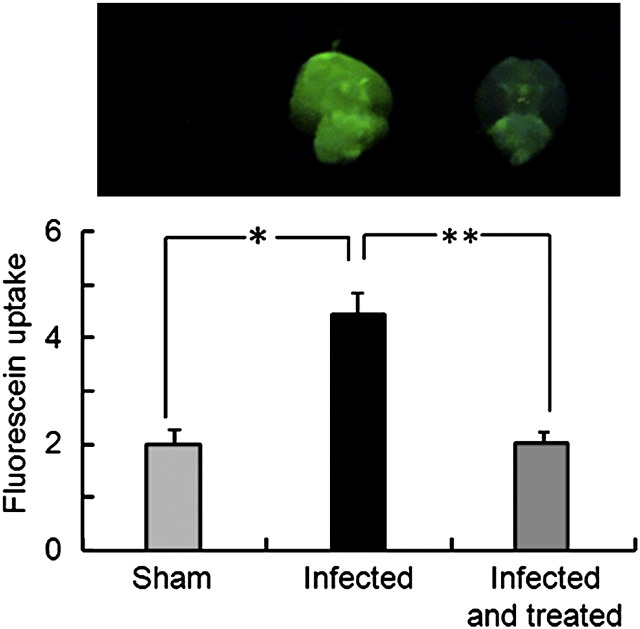
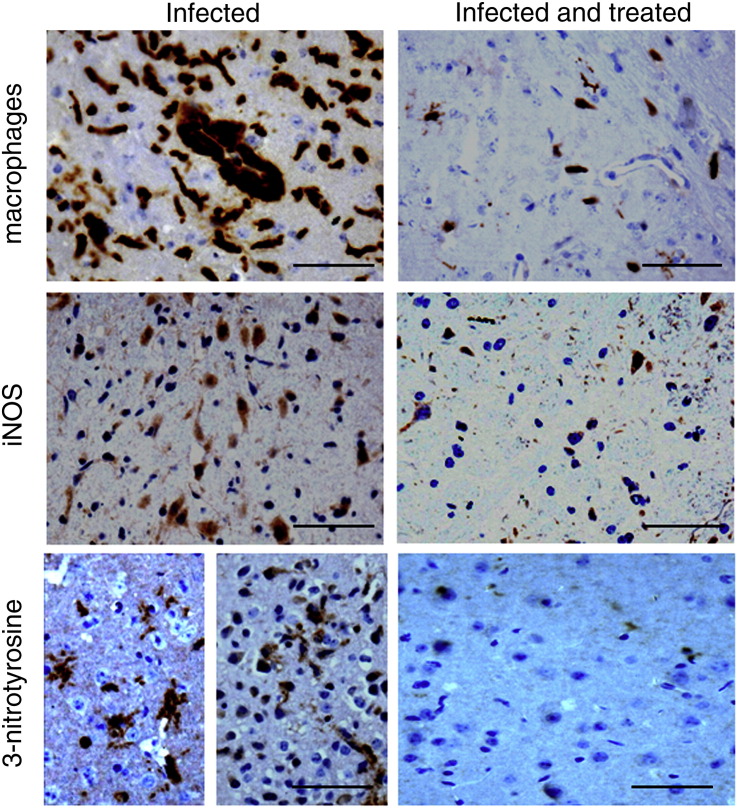
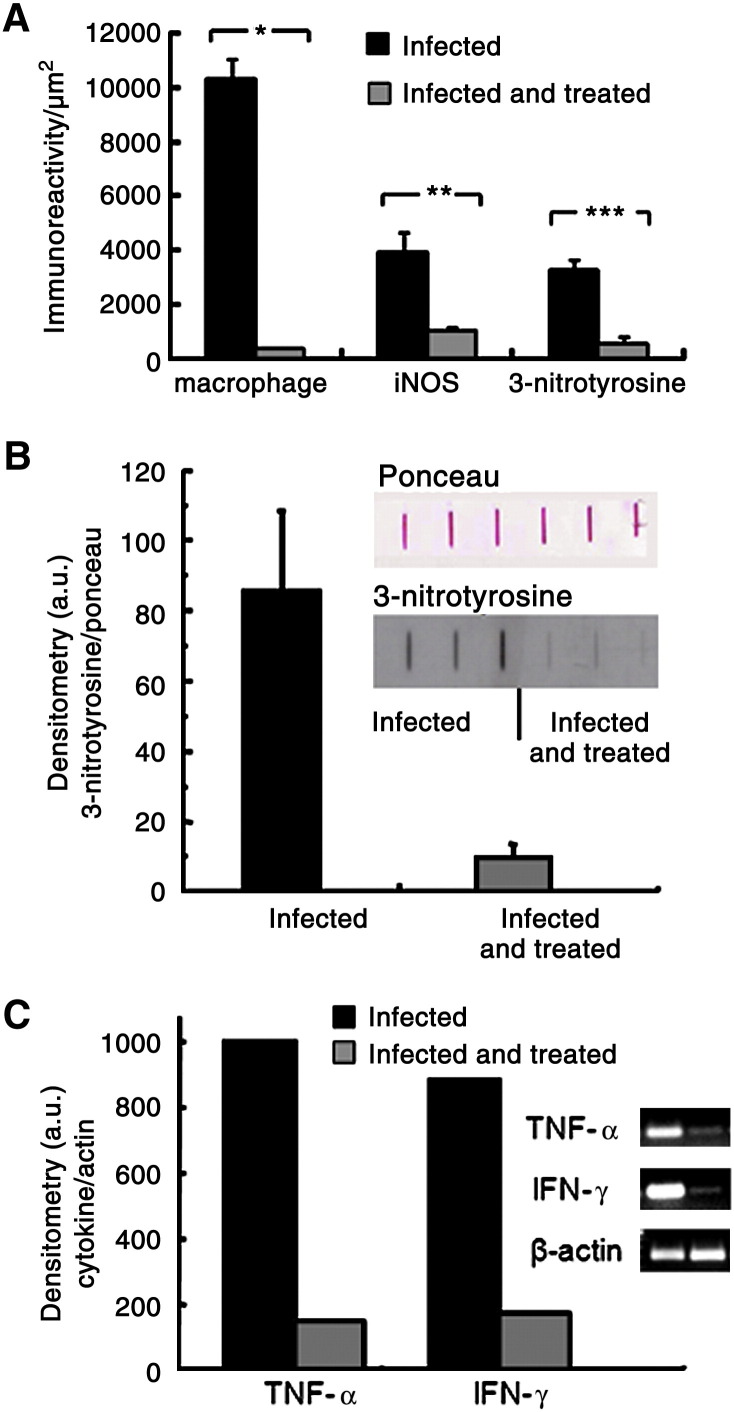
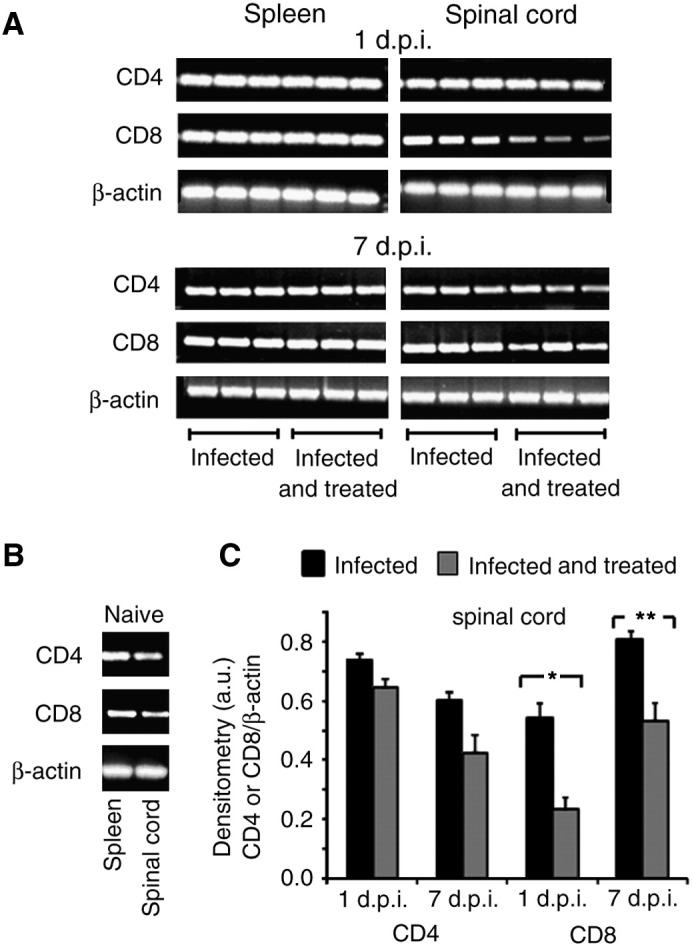
Multiple sclerosis (MS) is a progressive inflammatory and/or demyelinating disease of the human central nervous system (CNS). Most of the knowledge about the pathogenesis of MS has been derived from murine models, such as experimental autoimmune encephalomyelitis and viral encephalomyelitis. Here, we infected female C57BL/6 mice with a neurotropic strain of the mouse hepatitis virus (MHV-59A) to evaluate whether treatment with the multifunctional antioxidant tempol (4-hydroxy-2,2,6,6-tetramethyl-1-piperidinyloxy) affects the ensuing encephalomyelitis. In untreated animals, neurological symptoms developed quickly: 90% of infected mice died 10 days after virus inoculation and the few survivors presented neurological deficits. Treatment with tempol (24 mg/kg, ip, two doses on the first day and daily doses for 7 days plus 2 mM tempol in the drinking water ad libitum) profoundly altered the disease outcome: neurological symptoms were attenuated, mouse survival increased up to 70%, and half of the survivors behaved as normal mice. Not surprisingly, tempol substantially preserved the integrity of the CNS, including the blood-brain barrier. Furthermore, treatment with tempol decreased CNS viral titers, macrophage and T lymphocyte infiltration, and levels of markers of inflammation, such as expression of inducible nitric oxide synthase, transcription of tumor necrosis factor-alpha and interferon-gamma, and protein nitration. The results indicate that tempol ameliorates murine viral encephalomyelitis by altering the redox status of the infectious environment that contributes to an attenuated CNS inflammatory response. Overall, our study supports the development of therapeutic strategies based on nitroxides to manage neuroinflammatory diseases, including MS.
(c) 2009 Elsevier Inc. All rights reserved.
Figures
Similar articles
-
Inhibition of in vivo leishmanicidal mechanisms by tempol: nitric oxide down-regulation and oxidant scavenging.Free Radic Biol Med. 2008 Apr 15;44(8):1668-76. doi: 10.1016/j.freeradbiomed.2008.01.027. Epub 2008 Feb 12. Free Radic Biol Med. 2008. PMID: 18313408
-
Neuronal Ablation of Alpha/Beta Interferon (IFN-α/β) Signaling Exacerbates Central Nervous System Viral Dissemination and Impairs IFN-γ Responsiveness in Microglia/Macrophages.J Virol. 2020 Sep 29;94(20):e00422-20. doi: 10.1128/JVI.00422-20. Print 2020 Sep 29. J Virol. 2020. PMID: 32796063 Free PMC article.
-
The role of IL-10 in mouse hepatitis virus-induced demyelinating encephalomyelitis.Virology. 1998 Jun 5;245(2):270-80. doi: 10.1006/viro.1998.9170. Virology. 1998. PMID: 9636366
-
Cyclic nitroxides inhibit the toxicity of nitric oxide-derived oxidants: mechanisms and implications.An Acad Bras Cienc. 2008 Mar;80(1):179-89. doi: 10.1590/s0001-37652008000100013. An Acad Bras Cienc. 2008. PMID: 18345386 Review.
-
Pathogenesis of acute and chronic central nervous system infection with variants of mouse hepatitis virus, strain JHM.Immunol Res. 2007;39(1-3):160-72. doi: 10.1007/s12026-007-0079-y. Immunol Res. 2007. PMID: 17917063 Free PMC article. Review.
Cited by
-
Inflammation, immunity, and hypertension.Hypertension. 2011 Feb;57(2):132-40. doi: 10.1161/HYPERTENSIONAHA.110.163576. Epub 2010 Dec 13. Hypertension. 2011. PMID: 21149826 Free PMC article. Review. No abstract available.
-
Tempol, an intracellular antioxidant, inhibits tissue factor expression, attenuates dendritic cell function, and is partially protective in a murine model of cerebral malaria.PLoS One. 2014 Feb 28;9(2):e87140. doi: 10.1371/journal.pone.0087140. eCollection 2014. PLoS One. 2014. PMID: 24586264 Free PMC article.
-
Tempol moderately extends survival in a hSOD1(G93A) ALS rat model by inhibiting neuronal cell loss, oxidative damage and levels of non-native hSOD1(G93A) forms.PLoS One. 2013;8(2):e55868. doi: 10.1371/journal.pone.0055868. Epub 2013 Feb 6. PLoS One. 2013. PMID: 23405225 Free PMC article.
-
Immunomodulation by 4-Hydroxy-TEMPO (TEMPOL) and Dimethyl Fumarate (DMF) After Ventral Root Crush (VRC) in C57BL/6J Mice: A Flow Cytometry Analysis.Biology (Basel). 2025 Apr 25;14(5):473. doi: 10.3390/biology14050473. Biology (Basel). 2025. PMID: 40427663 Free PMC article.
-
Tempol protects against intravitreous indocyanine green-induced retinal damage in rats.Graefes Arch Clin Exp Ophthalmol. 2012 Nov;250(11):1597-606. doi: 10.1007/s00417-012-2000-1. Epub 2012 Mar 31. Graefes Arch Clin Exp Ophthalmol. 2012. PMID: 22460632
References
-
- 't Hart B.A., Hintzen R.Q., Laman J.D. Multiple sclerosis—a response-to-damage model. Trends Mol. Med. 2009;15:235–244. - PubMed
-
- Ebers G.C., Sadovnick A.D., Risch N.J. Canadian Collaborative Study Group. A genetic basis for familial aggregation in multiple sclerosis. Nature. 1995;377:150–151. - PubMed
-
- International Multiple Sclerosis Genetics Consortium Risk alleles for multiple sclerosis identified by a genomewide study. N. Engl. J. Med. 2007;357:851–862. - PubMed
-
- Risch N., Merikangas K. The future of genetic studies of complex human diseases. Science. 1996;273:1516–1517. - PubMed
Publication types
MeSH terms
Substances
LinkOut - more resources
Full Text Sources
Other Literature Sources
Medical
