. 2010 Apr 1;50(2):416-27.
doi: 10.1016/j.neuroimage.2009.12.070. Epub 2009 Dec 24.

Remote sites of structural atrophy predict later amyloid formation in a mouse model of Alzheimer's disease

Affiliations

Remote sites of structural atrophy predict later amyloid formation in a mouse model of Alzheimer's disease

Alexandra Badea et al. Neuroimage. .

Abstract

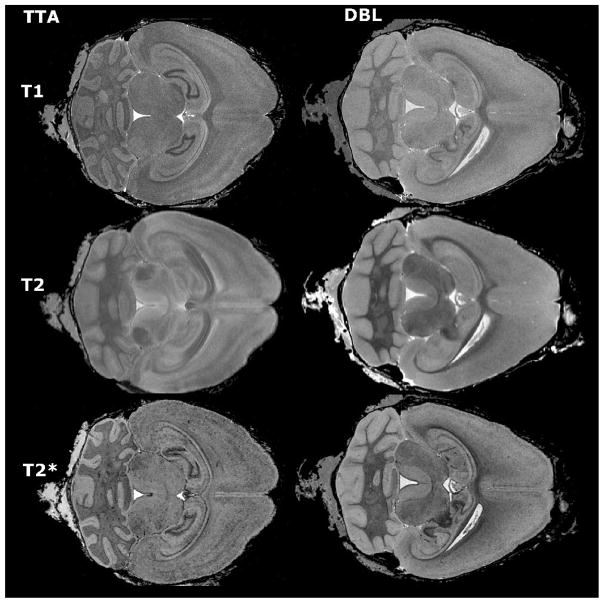
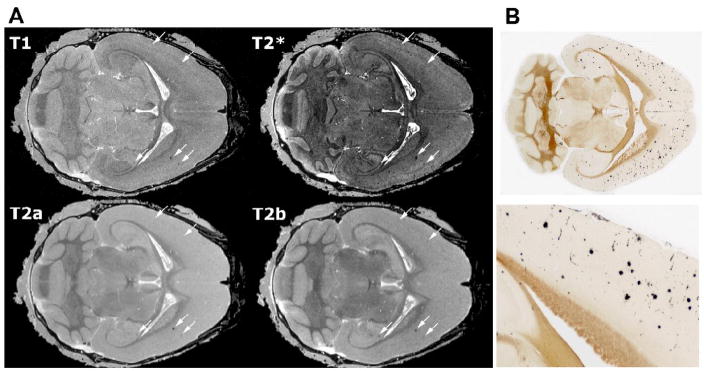
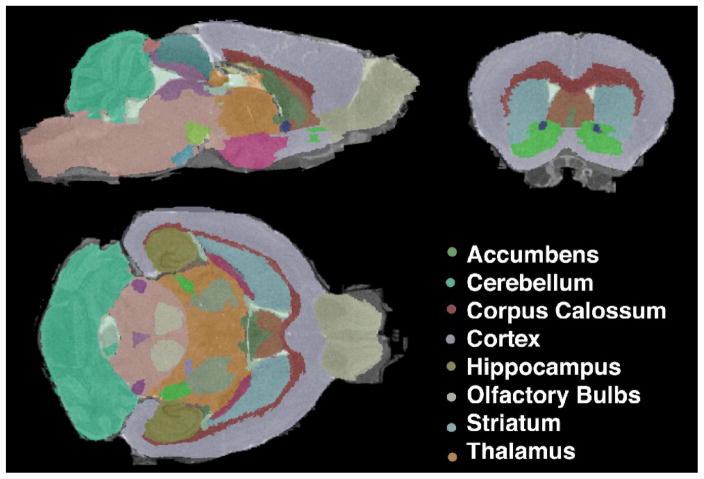
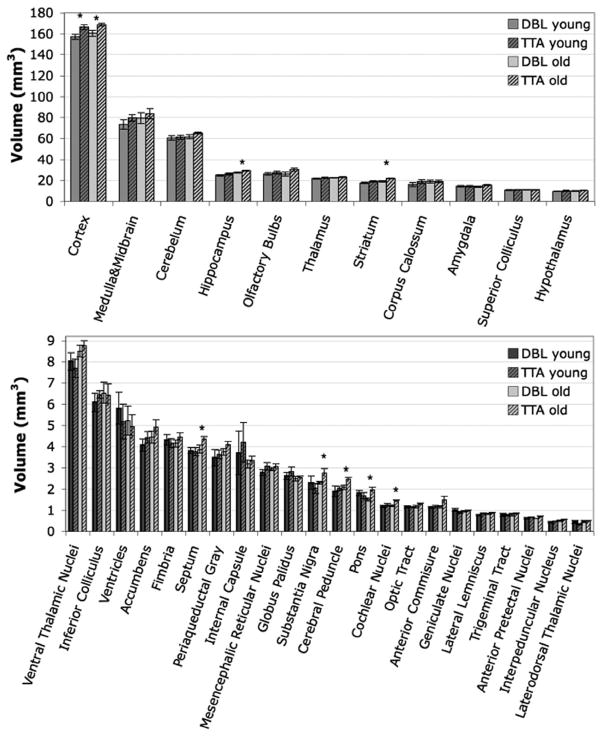
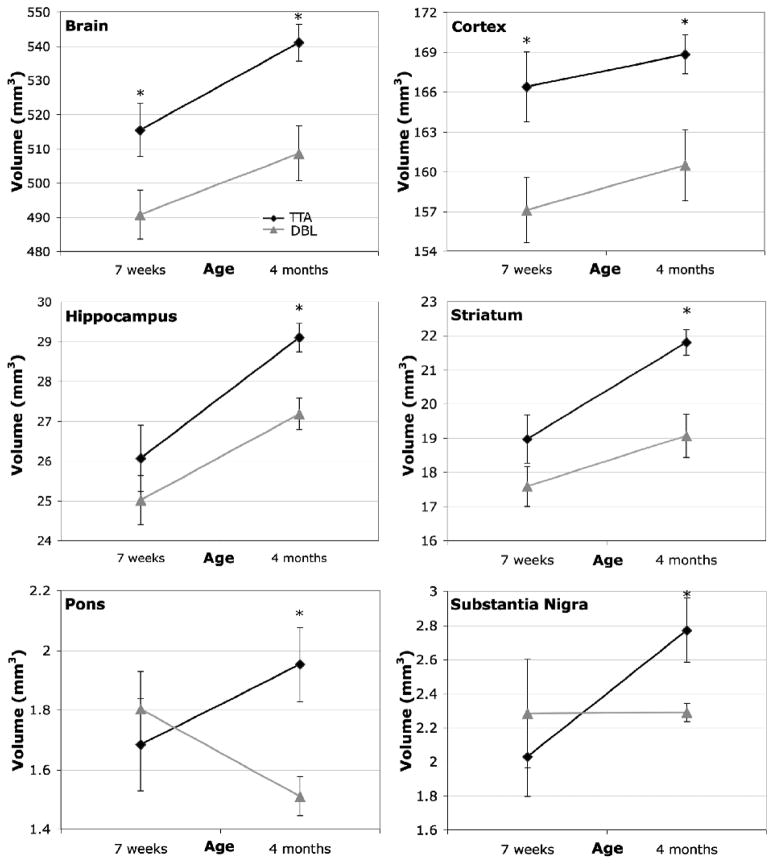
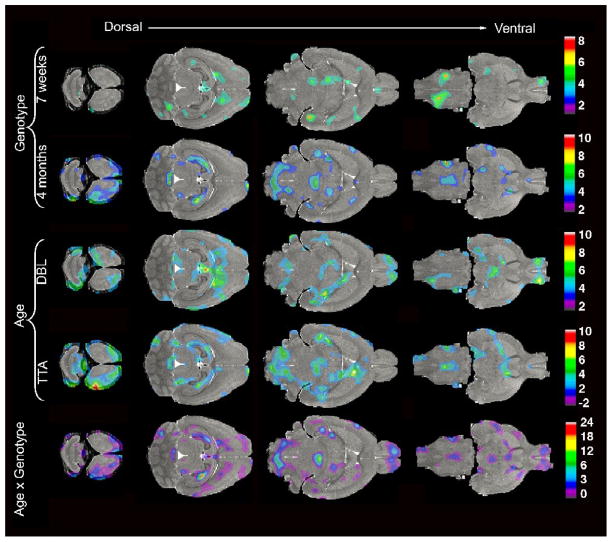
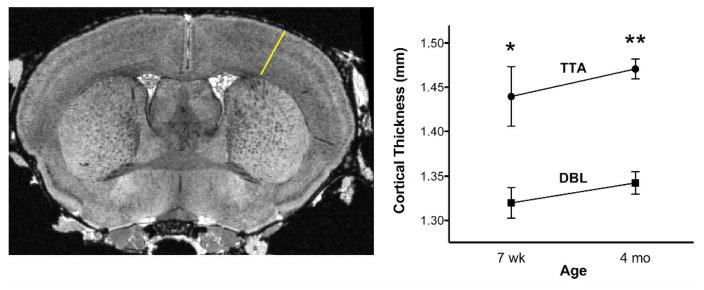
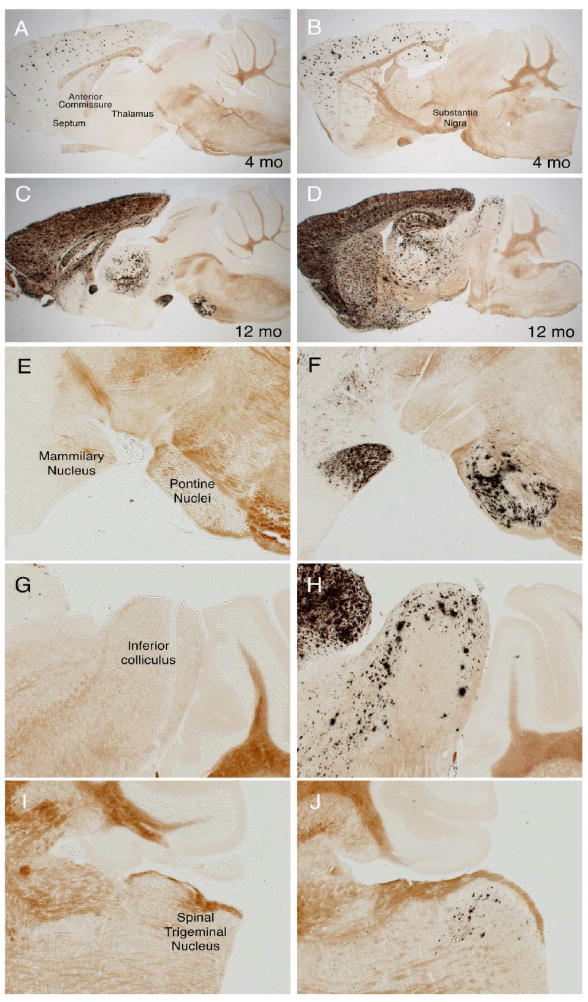
Magnetic resonance (MR) imaging can provide a longitudinal view of neurological disease through repeated imaging of patients at successive stages of impairment. Until recently, the difficulty of manual delineation has limited volumetric analyses of MR data sets to a few select regions and a small number of subjects. Increased throughput offered by faster imaging methods, automated segmentation, and deformation-based morphometry have recently been applied to overcome this limitation with mouse models of neurological conditions. We use automated analyses to produce an unbiased view of volumetric changes in a transgenic mouse model for Alzheimer's disease (AD) at two points in the progression of disease: immediately before and shortly after the onset of amyloid formation. In addition to the cortex and hippocampus, where atrophy has been well documented in AD patients, we identify volumetric losses in the pons and substantia nigra where neurodegeneration has not been carefully examined. We find that deficits in cortical volume precede amyloid formation in this mouse model, similar to presymptomatic atrophy seen in patients with familial AD. Unexpectedly, volumetric losses identified by MR outside of the forebrain predict locations of future amyloid formation, such as the inferior colliculus and spinal nuclei, which develop pathology at very late stages of disease. Our work provides proof-of-principle that MR microscopy can expand our view of AD by offering a complete and unbiased examination of volumetric changes that guide us in revisiting the canonical neuropathology.


Figures

Figure 1
Figure 1
Different imaging spectrums offer complementary information about brain structure. Multispectral images were acquired for both APP/TTA double transgenic mice (DBL) and TTA single transgenic controls (TTA). T1-weighted images provided the best structural definition and were used for segmentation (top row), T2-weighted images generated the best signal to noise ratio for detecting large amyloid plaques (middle row), while T2* (GRASS) images offered the best resolution for smaller deposits (bottom row).
Figure 2
Figure 2
Amyloid deposits are readily apparent in T2- and T2* weighted (GRASS) images. A. The largest plaques can be seen with all 3 sequences (arrows), although the best sensitivity is provided by T2*-weighted (GRASS) images and the best specificity by the MEFIC-processed T2-weighted images. All images shown here were taken from a DBL transgenic mouse 4 mo after APP induction; the top row displays high-resolution (21.5 μm) T1- and T2*-weighted (GRASS) images and the bottom row shows the first two echoes from a multiecho MEFIC processed T2-weighted image (a: 7 ms TE, b: 14 ms TE). While plaques can be seen in all images, the second echo (T2b) and the T2*-weighted images are better at discriminating smaller plaques. B. H istological staining confirms that DBL transgenic mice have a mild amyloid burden throughout the cortex and hippocampus by 4 mo of age. The lower panel shows the boxed region of the upper section at a higher magnification. Histological sections shown in B and MR slices shown in A are taken from different mice so no alignment of deposits with hypointensities is shown.
Figure 3
Figure 3
A high resolution C57BL/6 mouse brain atlas was used to segment T1-weighted images from DBL and TTA transgenic mice. Illustrated here is the segmentation of a DBL transgenic mouse following 4 months of APP overexpression.
Figure 4
Figure 4
Mean volumes (± SEM) for the 33 analyzed structures analyzed by atlas-based segmentation. Each genotype (DBL and TTA) was assessed at two ages (7 weeks and 4 months after inducing APP overexpression). Structures showing significant volume differences are indicated with asterisks and are expanded in Figure 5.
Figure 5
Figure 5
Eight of the 33 structures analyzed differed in volume between genotypes at one or both ages examined. Six of the eight are highlighted here. Significant changes were observed in overall brain volume (p<0.04, ci=[−48.11, −1.11]) and cortex (p<0.03, ci=[−17.28, −1.3]) prior to the onset of amyloid in the DBL mice (7 weeks). Volume deficits in these two regions persisted in the older amyloid-positive animals (overall brain (p<0.007, ci=[−54.10, −10.83]) and cortical volume (p<0.02, ci=[−15.11, −1.58])), with additional volume losses developing in the hippocampus (p<0.005, ci=[−3.11, −0.73]), striatum (p<0.004, ci = [−4.38, −1.09]), pons (p< 0.01, ci=[−0.76, −0.13]), and substantia nigra (p<0.03, ci=[−0.91,−0.05]), cochlear nucleus (p< 0.008, ci=[−0.36, −0.07]; not shown) and cerebral peduncle (p<0.03, ci=[−0.67, −0.06]; not shown).
Figure 6
Figure 6
Statistical analyses of the Jacobian fields (t maps thresholded at levels corresponding to p < 0.05) reveal local structural changes in the DBL transgenic mice. Anatomical differences between genotypes are apparent 7 weeks after APP induction in areas of the cortex, olfactory bulbs and hippocampus (top row). In the older age group (4 months) between-genotype comparisons identify changes in parts of the dorsal hippocampus, anterior-frontal cortex, olfactory bulbs, cerebellum, brainstem, and inferior colliculus (second row). Within-genotype comparisons of the two age groups highlight the normal growth of many regions throughout the brains of TTA control mice (fourth row). Age-related changes in DBL mice are more difficult to discern, likely due to the opposing effects of growth and degeneration (third row). The interaction between age and genotype is significant in the dorsal cortex, hippocampus, inferior colliculus, medial septum, and regions of the brainstem (bottom row).
Figure 7
Figure 7
Cortical thinning appears prior to amyloid formation. Measurements through the somatosensory cortex were made from the same rostral-caudal plane for each animal (white line in left panel); graph displays mean ± SEM for each age and genotype (7 wk: p < 0.01, ci = [−0.21, −0.03]; 4 mo: p < 1.94*10−5, ci=[−0.21,−0.04]).
Figure 8
Figure 8
MR analyses predict unexpected sites of future amyloid formation in mid- and hindbrain structures. A, C, E, G and I. Volumetric MR analyses detect significant loss or diminished growth in multiple structures outside of the neocortex following 4 months of APP overexpression, but at this stage of disease amyloid pathology appears only in the forebrain. B. D, F, H, and J. Much later in the disease (after 12 months of APP overexpression) several regions identified by MR ultimately develop amyloid pathology (arrows in B and D), suggesting that structural alterations occur long before amyloid formation. Because overexpression of transgenic APP is limited to the forebrain, damage to these mid- and hindbrain structures must arise through different connections to rostral structures. All panels show double transgenic APP102/TTA sections stained with Campbell-Switzer silver method for amyloid plaques; animals pictured here were not used for MR imaging. A–D show low magnification images from two different sagittal planes, E–F show higher magnification images of miodbrain structures in A and B; G–J show higher magnification images of mid- and hindbrain structures in C and D.
Figure 9
Figure 9
Body weight varies with gender and age but not with genotype. Comparison of male (M) and female (F) DBL and TTA transgenic animals at each time point used for imaging indicates no effect of genotype on overall body weight. Each data point represents a single animal; lines show mean ± SEM. Animals used for weight analysis were distinct from those used for imaging but were derived from the same congenic colony and reared under the same postnatal doxycycline regimen. No significant differences in mean weight were found between genotypes matched for gender and age (n=15, 13, 9, 18, 14, 14, 7, 15, per group as shown on graph, Student’s t-test). One comparison (M, 7 wk) approached significance (p=0.0653, ci −2.218 to 0.07365), however, this difference was not apparent 9 weeks later (p=0.6849, ci −1.53 to 2.282).

Similar articles

Cited by

References

    1. Badea A, Ali-Sharief AA, Johnson GA. Morphometric analysis of the C57BL/6J mouse brain. Neuroimage. 2007;37:683–693. - PMC - PubMed
    1. Buckner RL, Snyder AZ, Shannon BJ, LaRossa G, Sachs R, Fotenos AF, Sheline YI, Klunk WE, Mathis CA, Morris JC, Mintun MA. Molecular, structural, and functional characterization of Alzheimer’s disease: evidence for a relationship between default activity, amyloid, and memory. J Neurosci. 2005;25:7709–7717. - PMC - PubMed
    1. Busatto GF, Diniz BS, Zanetti MV. Voxel-based morphometry in Alzheimer’s disease. Expert Rev Neurother. 2008;8:1691–1702. - PubMed
    1. Busch C, Bohl J, Ohm TG. Spatial, temporal and numeric analysis of Alzheimer changes in the nucleus coeruleus. Neurobiol Aging. 1997;18:401–406. - PubMed
    1. Chung MK, Worsley KJ, Paus T, Cherif C, Collins DL, Giedd JN, Rapoport JL, Evans AC. A unified statistical approach to deformation-based morphometry. Neuroimage. 2001;14:595–606. - PubMed

Publication types