. 2010 Apr 15;399(2):182-9.
doi: 10.1016/j.ab.2009.12.027. Epub 2009 Dec 28.

Non-natural amino acid fluorophores for one- and two-step fluorescence resonance energy transfer applications

Affiliations

Non-natural amino acid fluorophores for one- and two-step fluorescence resonance energy transfer applications

Julie M G Rogers et al. Anal Biochem. .

Abstract

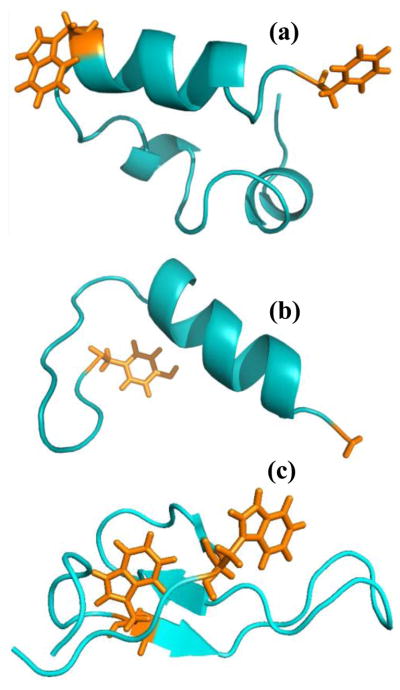
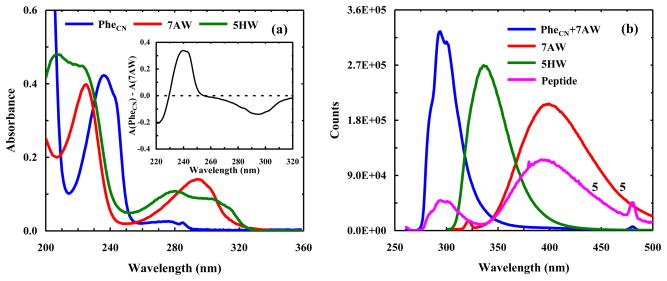
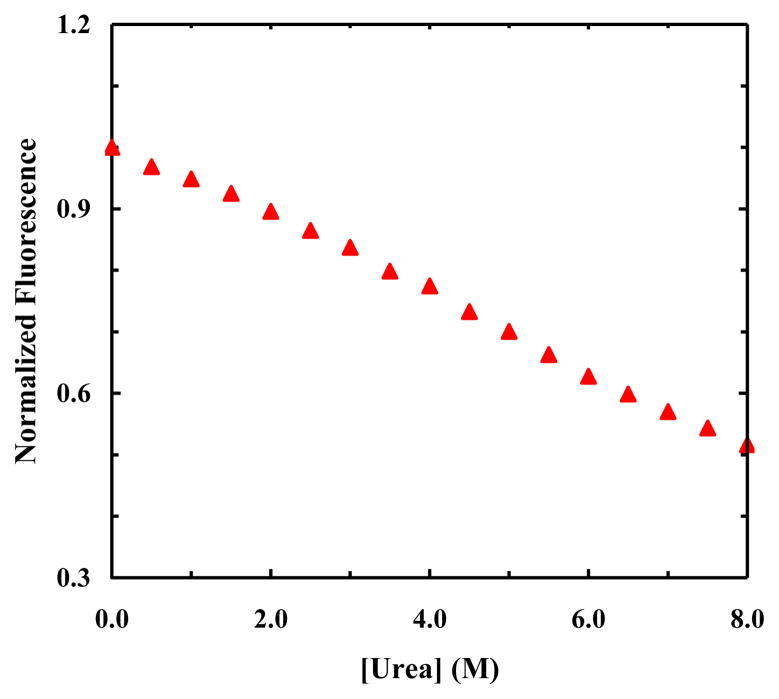
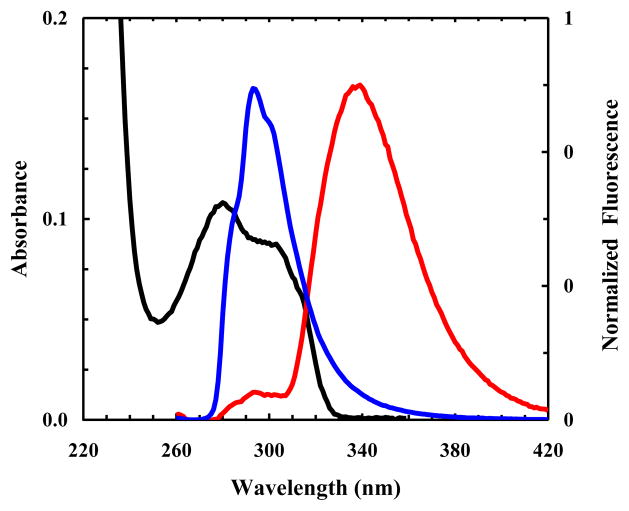
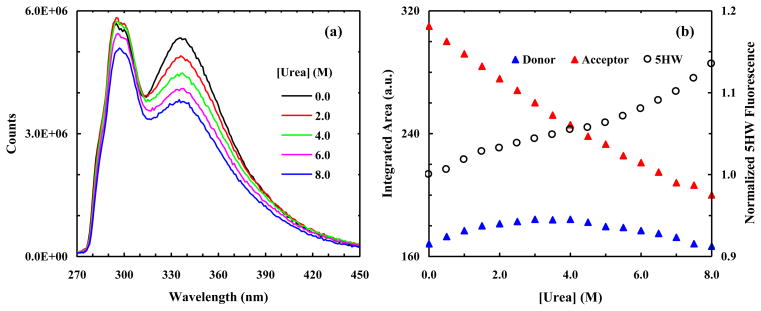
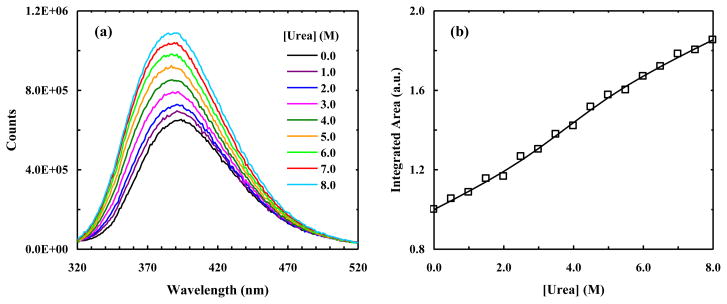
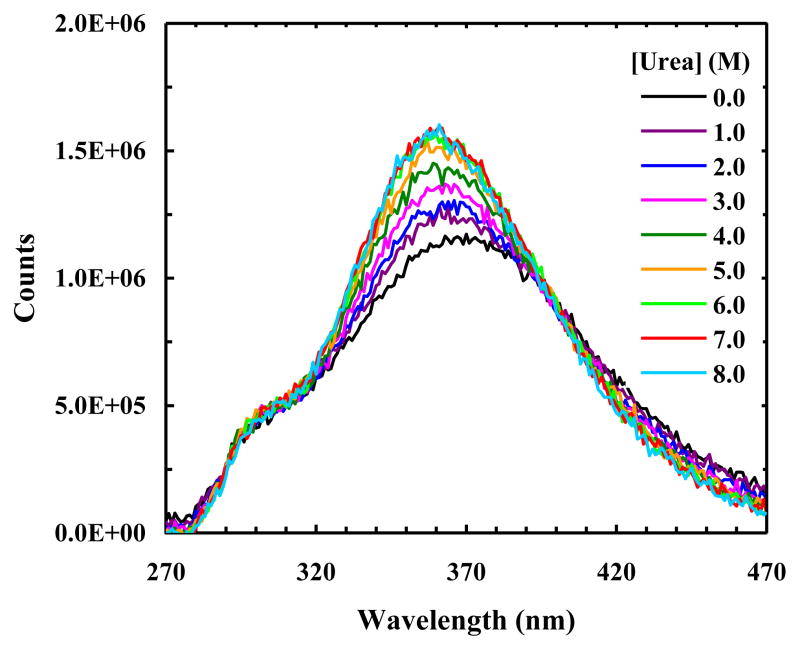
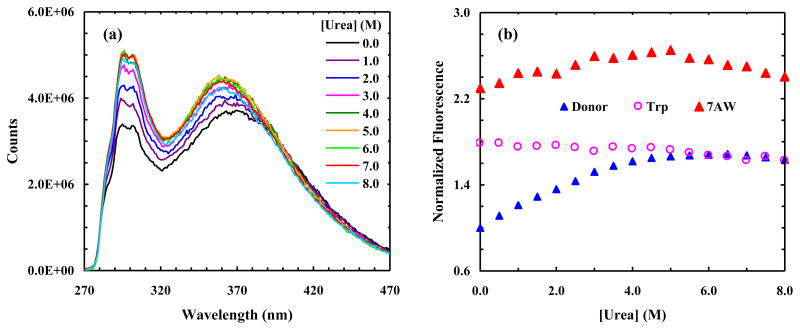
Fluorescence resonance energy transfer (FRET) provides a powerful means to study protein conformational changes. However, the incorporation of an exogenous FRET pair into a protein could lead to undesirable structural perturbations of the native fold. One of the viable strategies to minimizing such perturbations is to use non-natural amino acid-based FRET pairs. Previously, we showed that p-cyanophenylalanine (Phe(CN)) and tryptophan (Trp) constitute such a FRET pair, useful for monitoring protein folding-unfolding transitions. Here we further show that 7-azatryptophan (7AW) and 5-hydroxytryptophan (5HW) can also serve as a FRET acceptor to Phe(CN), and the resultant FRET pairs offer certain advantages over Phe(CN)-Trp. For example, the fluorescence spectrum of 7AW is sufficiently separated from that of Phe(CN), making it straightforward to decompose the FRET spectrum into donor and acceptor contributions. Moreover, we show that Phe(CN), Trp, and 7AW can be used together to form a multi-FRET system, allowing more structural information to be extracted from a single FRET experiment. The applicability of these FRET systems is demonstrated in a series of studies where they are employed to monitor the urea-induced unfolding transitions of the villin headpiece subdomain (HP35), a designed betabetaalpha motif (BBA5), and the human Pin1 WW domain.


Figures

Figure 1
Figure 1
(a) NMR structure of HP35 (PDB code 1VII), (b) NMR structure of BBA5 (PDB code 1T8J), and (c) NMR structure of the hPin1 WW domain (PDB code 2KCF). The sidechains involved in the FRET mutations in HP35 and BBA5 are shown, whereas for WW domain, only the Trp sidechains are shown.
Figure 2
Figure 2
(a) Absorption spectra of PheCN, 7AW, and 5HW in water, as indicated. These spectra were collected at room temperature and the concentration of the amino acid was 20 μM. Also shown in the inset is the difference between these spectra, which indicates that PheCN and 7AW can be selectively excited, e.g., at 240 and 290 nm, respectively. (b) Fluorescence spectra of 7AW, 5HW, a 1:1 mixture of PheCN and 7AW, and a control peptide (sequence: G-7AW-K-PheCN-T-V) in water at 20 °C. For 7AW and 5HW, the excitation wavelength was 290 nm, whereas for the peptide and the mixture of PheCN and 7AW, the excitation wavelength was 240 nm. The concentration of the amino acids only was 20 μM, and that of the peptide and each amino acid in the PheCN + 7AW mixture was 16 μM. For easy comparison, the peptide and 7AW spectra have been multiplied by a factor of five.
Figure 3
Figure 3
(a) Representative fluorescence spectra of HP35-AP obtained with λex = 240 nm and at different urea concentrations, as indicated. (b) Normalized fluorescence intensities of the donor (PheCN) and acceptor (7AW) versus urea concentration, as indicated. These data correspond to the maximum values of the respective PheCN and 7AW fluorescence emissions in the FRET spectra, e.g., those in (a). Also shown (open circle) is the normalized fluorescence intensity of 7AW obtained with λex = 310 nm using the same sample as that used in the corresponding FRET measurement.
Figure 4
Figure 4
Normalized fluorescence intensity of 7AW in HP35-AP versus urea concentration. These data correspond to the ratio between the fluorescence intensity of 7AW obtained with λex = 240 nm and that obtained with λex = 310 nm.
Figure 5
Figure 5
Absorption spectrum of 5HW (black). Also shown are the fluorescence spectra of free PheCN (blue) and a control peptide (G-5HW-K-PheCN-T-V) (red) obtained with λex = 240 nm. For easy comparison, the fluorescence data have been normalized.
Figure 6
Figure 6
(a) Representative fluorescence spectra of BBA5-PH obtained with λex = 240 nm and at different urea concentrations, as indicated. (b) Fluorescence intensities (integrated area) of the donor (PheCN) and acceptor (5HW) of BBA5-PH versus urea concentration. Also shown (open cycle) is the maximum fluorescence intensity of 5HW obtained with λex = 290 nm using the same sample as that used in the corresponding FRET measurement.
Figure 7
Figure 7
(a) Representative fluorescence spectra of W7AW-P obtained with λex = 310 nm and at different urea concentrations, as indicated. (b) Integrated area of the fluorescence spectrum of W7AW-P obtained with λex = 310 nm versus urea concentration. The solid line represents the best fit of these data to a two-state model.
Figure 8
Figure 8
Fluorescence spectra of W7AW-P obtained with λex = 240 nm and at different urea concentrations, as indicated.
Figure 9
Figure 9
(a) Representative fluorescence spectra of W7AW-P2 obtained at 4 °C with λex = 240 nm and different urea concentrations, as indicated. (b) Normalized fluorescence intensities (integrated area) of the donor (PheCN) and acceptors (7AW and Trp) of W7AW-P2 versus urea concentration, as indicated. All fluorescence intensities are normalized to that of the PheCN obtained in 0 M urea solution.

Similar articles

Cited by

References

    1. Förster T. Annalen der Physik. 1948;2:55–75.; English translation in Mielczarek EV, Greenbaum E, Knox RS, editors. Biological Physics. American Institute of Physics; New York: 1993. pp. 148–160.

    1. Kang JS, Piszczek G, Lakowicz JR. Enhanced emission induced by FRET from a long-lifetime, low quantum yield donor to a long-wavelength, high quantum yield acceptor. J Fluoresc. 2002;12:97–103. - PMC - PubMed
    1. Hass E. The study of protein folding and dynamics by determination of intermolecular distance distributions and their fluctuations using ensemble and single-molecule FRET measurements. ChemPhysChem. 2005;6:858–870. - PubMed
    1. Tucker MJ, Oyola R, Gai F. Conformational distribution of a 14-residue peptide in solution: A fluorescence resonance energy transfer study. J Phys Chem B. 2005;109:4788–4795. - PubMed
    1. Tucker MJ, Tang J, Gai F. Probing the kinetics of membrane-mediated helix folding. J Phys Chem B. 2006;110:8105–8109. - PubMed

Publication types

MeSH terms

LinkOut - more resources