. 2010 Mar 12;396(5):1451-73.
doi: 10.1016/j.jmb.2009.12.037. Epub 2009 Dec 28.

Evolutionary trace annotation of protein function in the structural proteome

Affiliations

Evolutionary trace annotation of protein function in the structural proteome

Serkan Erdin et al. J Mol Biol. .

Abstract

By design, structural genomics (SG) solves many structures that cannot be assigned function based on homology to known proteins. Alternative function annotation methods are therefore needed and this study focuses on function prediction with three-dimensional (3D) templates: small structural motifs built of just a few functionally critical residues. Although experimentally proven functional residues are scarce, we show here that Evolutionary Trace (ET) rankings of residue importance are sufficient to build 3D templates, match them, and then assign Gene Ontology (GO) functions in enzymes and non-enzymes alike. In a high-specificity mode, this Evolutionary Trace Annotation (ETA) method covered half (53%) of the 2384 annotated SG protein controls. Three-quarters (76%) of predictions were both correct and complete. The positive predictive value for all GO depths (all-depth PPV) was 84%, and it rose to 94% over GO depths 1-3 (depth 3 PPV). In a high-sensitivity mode, coverage rose significantly (84%), while accuracy fell moderately: 68% of predictions were both correct and complete, all-depth PPV was 75%, and depth 3 PPV was 86%. These data concur with prior mutational experiments showing that ET rank information identifies key functional determinants in proteins. In practice, ETA predicted functions in 42% of 3461 unannotated SG proteins. In 529 cases--including 280 non-enzymes and 21 for metal ion ligands--the expected accuracy is 84% at any GO depth and 94% down to GO depth 3, while for the remaining 931 the expected accuracies are 60% and 71%, respectively. Thus, local structural comparisons of evolutionarily important residues can help decipher protein functions to known reliability levels and without prior assumption on functional mechanisms. ETA is available at http://mammoth.bcm.tmc.edu/eta.


Figures

Figure 1
Figure 1
Reciprocal match between Mycobacterium tuberculosis v1626 (PDB 1sd5, chain A; green cartoon) to Tolypothrix species PCC 7601 phytochrome response regulator rcpb (PDB 1k66, chain A; orange cartoon). ET analysis of 1sd5A identified a 10-residue functional site (yellow spheres), from which the template picker chose six residues (D21, P59, D65, A93, Y111, K114, red spheres). Their Cα coordinates and amino acid types (with some variations allowed) matched 1k66A (D14, P63, D69, T100, Y118, K121, red spheres). A trace of 1k66A identified a 10-residue functional site, and six residues were chosen for a template (E13, D14, D69, P73, K121, P122, blue spheres), which reciprocally matched 1sd5 (E20, D21, D65, P69, K114, P115, blue spheres). Three residues (D21, D65, K114 from 1sd5A; D14, D69, K121 from 1k66A; purple spheres) were in both templates.
Figure 2
Figure 2
Illustration and examples of plurality voting procedure with GO molecular function terms. Each box is a GO term. Green boxes represent terms accepted by the voting procedure; red boxes were rejected. Colored dots next to the box represent a match with that function, and correspond to the matches shown at the side of each figure. 2a Annotation of 1nhz, chain A, illustrating the assignment of multiple functions to a protein when there are ties; 2b Annotation of 1q45, chain A, illustrating the prediction of the most specific term available; 2c Annotation of 2p68A, illustrating a case where an initially rejected term (Transferase, GO:0016740) is included if one of its children is selected.
Figure 2
Figure 2
Illustration and examples of plurality voting procedure with GO molecular function terms. Each box is a GO term. Green boxes represent terms accepted by the voting procedure; red boxes were rejected. Colored dots next to the box represent a match with that function, and correspond to the matches shown at the side of each figure. 2a Annotation of 1nhz, chain A, illustrating the assignment of multiple functions to a protein when there are ties; 2b Annotation of 1q45, chain A, illustrating the prediction of the most specific term available; 2c Annotation of 2p68A, illustrating a case where an initially rejected term (Transferase, GO:0016740) is included if one of its children is selected.
Figure 3
Figure 3
ETA performance. The performance of reciprocal ETA performance as matches above a sequence identity cutoff were removed is shown (the test sets remain the same size in all cases), as are additional predictions made by all-match ETA. Proteins with correct and complete predictions are shown in red; incomplete, orange; partially correct, yellow; incorrect, gray; no predictions, white. Coverage (orange circles, depth 3 PPV (red squares), all-depth PPV (red circles), and fraction correct and complete (red triangles) are plotted against the right axis. 3a Performance for 1889 SG enzymes. 3b Proof-of-concept performance for 50 non-SG non-enzymes. 3c Performance for 311 SG non-enzymes. 3d Performance for 184 SG ion-binding proteins.
Figure 4
Figure 4
Reciprocal ETA performance at varying GO depths. Performance is reported only with respect to predictions at that depth, using the color scheme from Figure 3 (substituting best-case PPV for depth 3 PPV, incomplete PPV for all-depth PPV, and lower bound PPV for the fraction correct and complete). 4a Performance for 1889 SG enzymes. 4b Performance for 311 SG non-enzymes.
Figure 5
Figure 5
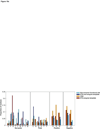
Comparisons of ETA performance for SG proteins to other methods. ETA is compared, using the color scheme in Figure 3, to JAFA for 50 enzymes, 311 non-enzymes, and 184 ion-binding proteins; and is compared to ProFunc’s Reverse Templates method (RT) for 120 enzymes and 224 non-enzymes.
Figure 6
Figure 6
Distribution of match sequence identity for un-annotated proteins. Histogram showing the percentage sequence identity for ETA-annotated SG proteins with their highest sequence identity match.
Figure 7
Figure 7
Overlap between template residues and known functional sites for 846 enzymes, 63 non-enzymes and 184 metal ion-binding SG proteins. The number of overlapping residues is shown in the legend; when no residues overlapped, templates were divided into those that were within 10 Å of any non-hydrogen atom and those farther away from the functional site.
Figure 8
Figure 8
Examples of non-enzyme templates. Green cartoon, query protein; purple, reciprocal template residues; red, one-to-many residues; blue, bound ions, ligands or protein-protein interface residues. 7a 1bmo, chain A, with calcium ion; 7b 1gzx, chain B, with a heme molecule; 7c Human growth hormone 1a22, chain A, and human growth hormone receptor 1a22, chain B, (orange cartoon) with the hormone receptor’s interface residues R271, W304, I305 and P306.
Figure 9
Figure 9
Annotation performance for ETA’s template picker and two control template pickers. Performance is shown for both one-to-many and reciprocal ETA (the many-to-one portion of the reciprocal search used the standard ETA template picker). ETA templates were constructed as described elsewhere. Positive controls are constructed from known functional sites as described below. Negative control templates are constructed from poorly ranked ET residues that are not near the known functional site. 8a Performance for 51 SG enzymes. CSA+ETA (positive control) templates start with CSA residues and then supplement these with nearby highly ranked ET residues. 8b Performance for 41 SG non-enzymes. “Binding+ETA” (positive control) templates start with residues from a ligand or ion-binding site and supplement these with nearby highly ranked ET residues.
Figure 10
Figure 10
Composition of ETA enzyme templates and CSA residues (846 SG proteins); and of non-enzyme templates and non-enzyme binding sites (63 SG proteins). 9a Amino acid composition. 9b Secondary structure composition.
Figure 10
Figure 10
Composition of ETA enzyme templates and CSA residues (846 SG proteins); and of non-enzyme templates and non-enzyme binding sites (63 SG proteins). 9a Amino acid composition. 9b Secondary structure composition.

References

    1. Lee D, Redfern O, Orengo C. Predicting protein function from sequence and structure. Nat Rev Mol Cell Biol. 2007;8:995–1005. - PubMed
    1. Rentzsch R, Orengo CA. Protein function prediction - the power of multiplicity. Trends Biotechnol. 2009 - PubMed
    1. Chandonia JM, Brenner SE. The impact of structural genomics: expectations and outcomes. Science. 2006;311:347–351. - PubMed
    1. Burley SK. An overview of structural genomics. Nat. Struct. Biol. 2000;(7 Suppl):932–934. - PubMed
    1. Brenner SE. A tour of structural genomics. Nat Rev Genet. 2001;2:801–809. - PubMed

Publication types