Review
. 2010 Sep;52(3):752-65.
doi: 10.1016/j.neuroimage.2009.12.068. Epub 2009 Dec 28.

Computational and dynamic models in neuroimaging

Affiliations
Review

Computational and dynamic models in neuroimaging

Karl J Friston et al. Neuroimage. 2010 Sep.

Abstract

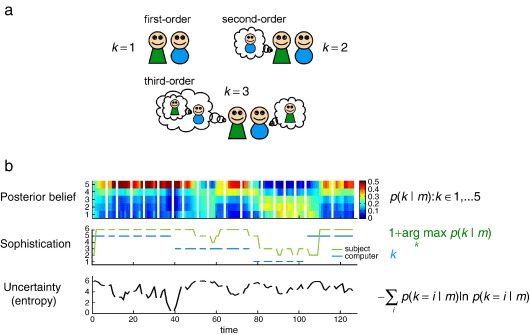
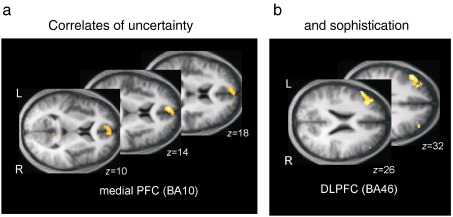
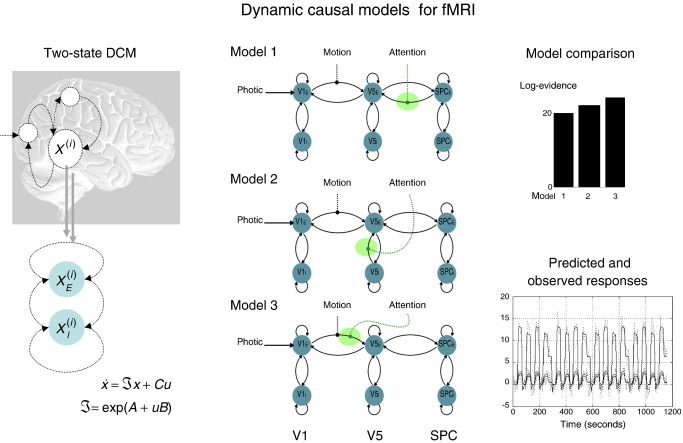
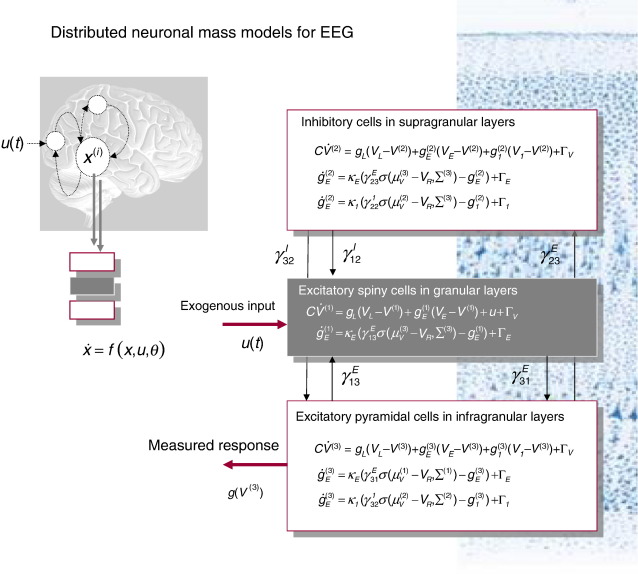
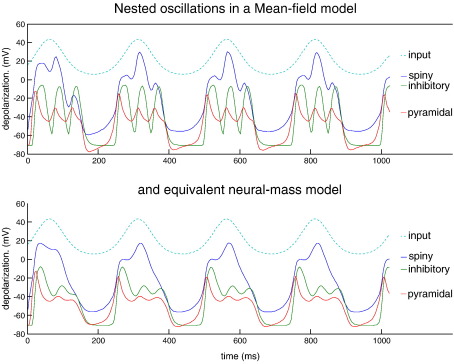
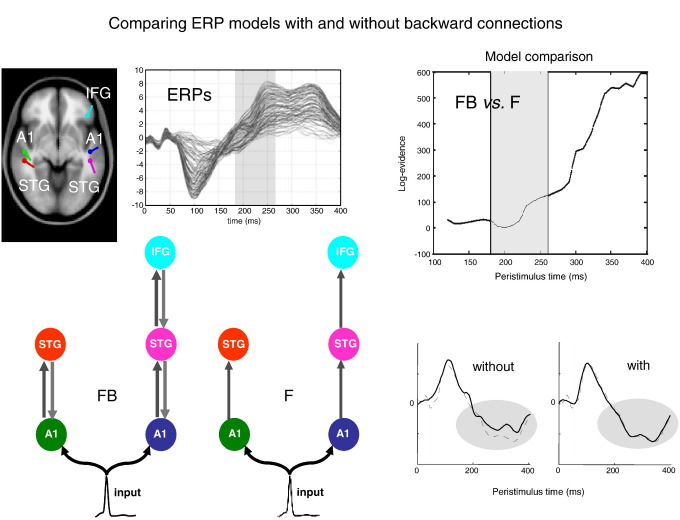
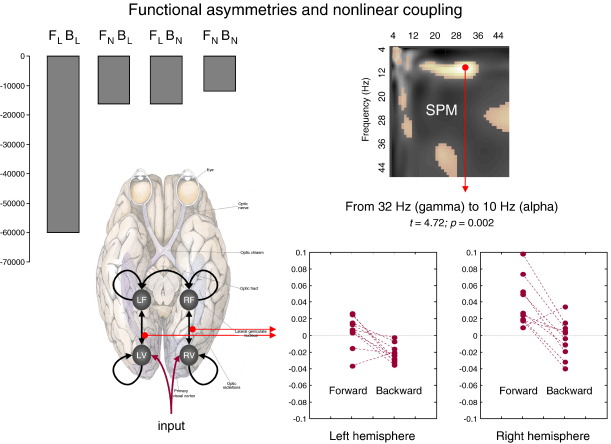
This article reviews the substantial impact computational neuroscience has had on neuroimaging over the past years. It builds on the distinction between models of the brain as a computational machine and computational models of neuronal dynamics per se; i.e., models of brain function and biophysics. Both sorts of model borrow heavily from computational neuroscience, and both have enriched the analysis of neuroimaging data and the type of questions we address. To illustrate the role of functional models in imaging neuroscience, we focus on optimal control and decision (game) theory; the models used here provide a mechanistic account of neuronal computations and the latent (mental) states represent by the brain. In terms of biophysical modelling, we focus on dynamic causal modelling, with a special emphasis on recent advances in neural-mass models for hemodynamic and electrophysiological time series. Each example emphasises the role of generative models, which embed our hypotheses or questions, and the importance of model comparison (i.e., hypothesis testing). We will refer to this theme, when trying to contextualise recent trends in relation to each other.


Figures

Fig. 1
Fig. 1
How to access the brain's computational states. This figure illustrates the sort of analyses used to estimate latent computational variables states, which are then used to explain fMRI responses. This example considers the inferential (mental) states of a subject during cooperative game-playing. Cooperative (and competitive) interactions rest on the ability to make inferences about the intentions of others, this is referred to as Theory of Mind. However, this poses a fundamental problem for the brain, in that a representation of another's intentions includes their model of our intentions, and their model of our model of theirs, and so on ad infinitum (see panel a). Yoshida et al. (2008, 2010) addressed this problem using a game theoretic task (with a ‘stag-hunt’ pay-off structure): during scanning, subjects played with an opponent (a computer) to competitively catch low-valued prey (‘rabbits’) or cooperatively catch high-valued prey (‘stags’). The subject's beliefs about the opponent were estimated using a Theory of Mind model, which assumes an upper bound on the subject's recursion of reciprocal beliefs or ‘sophistication’. Crucially, this bound resolves the infinite regress above. Panel b (upper panel) shows how one subject updated their posterior beliefs about the opponent's sophistication (k) at each trial (where each game is separated by a gap). These beliefs were derived under (bounded) Bayes optimality assumptions on the basis of their behaviour. The middle panel shows the sophistication of the computer's actual strategy (blue) and the subject's sophistication (green). This should be one level higher that the most likely level of the opponent's sophistication. The lower panel shows the subject's uncertainty about the opponent's sophistication, as measured by the entropy of the posterior distribution over k in the upper panel. The estimate of sophistication (green) and uncertainty about that estimate (black) were then used as stimulus functions to identify the neuronal correlates of their respective representations in the brain. The results of this analysis are shown in Fig. 2.
Fig. 2
Fig. 2
Computational fMRI based on game theory of mind. Statistical parametric maps showing the neuronal (fMRI) correlates of beliefs about an opponent's sophistication (under bounded rationality assumptions) and the uncertainty about those beliefs (see Fig. 1). These regionally specific correlates are within a prefrontal Theory of Mind network. In particular, activity within medial prefrontal cortex correlated with uncertainty about an opponent's sophistication (a); while dorsolateral activity correlated with the inferred level of sophistication per se (b). The findings suggest functional specialization for inference on the sophistication of others, a process attributed to Theory of Mind. Crucially, these results could not have been obtained without quantifying beliefs and uncertainly. Computational fMRI appeals to computational or theoretical models to infer these latent variables; where, in this sophisticated (sic) example, the model was optimised using observed behaviour. See Yoshida et al. (2010) for further details.
Fig. 3
Fig. 3
Dynamical causal modelling for fMRI. Dynamical causal modelling (DCM) tries to infer directed connectivity among brain regions or sources. These models distinguish between a neuronal level, which models neuronal interactions among regions and an observation level, which, for fMRI, models the ensuing hemodynamic responses. Here, we look at the attentional modulation of evoked responses (in the context of visual motion processing) and see that it is best explained by an increased sensitivity of excitatory populations of neurons in V5 to forward afferents from earlier visual areas. Left: This example uses a DCM with two neuronal states (populations) per region. which affords an explicit model of intrinsic (between-population) connectivity within a region. In addition, by using positivity constraints (through the exponential in the neuronal state equation), the model reflects the organisation of real cortical hierarchies, whose extrinsic connections are excitatory (glutamatergic). Excitatory and inhibitory neuronal states for the ith region are denoted by x(i)⊇{xE(i), xI(i)} and exogenous (experimental) inputs (such as photic stimulation, motion or attention) are encoded by u⊇{u1, u2, …}. By comparing these sorts of DCM, one can disambiguate among competing hypotheses about the locus of context-sensitive changes in coupling, I(u). Middle: In all three models considered here, photic stimulation enters V1 and motion modulates the connection from V1 to V5, and all assume reciprocal and hierarchical extrinsic (between region) connections. The models differ in how attention modulates the influences on the excitatory population in V5 (green ellipses): model 1 assumes modulation of backward extrinsic connections, model 2 assumes modulation of intrinsic connections and model 3 assumes modulation of forward connections. Right: The results of Bayesian model comparison (upper graph) are shown in terms of the log evidence for each model: Model 3 (modulation of the forward connections by attention) is selected over other two models. The lower graph shows the predicted an observed regional responses under this model. See Marreiros et al. (2008) for details.
Fig. 4
Fig. 4
Dynamical causal modelling for EEG. Neuronally plausible, generative or forward models are essential for understanding how event-related fields (ERFs) and potentials (ERPs) are generated. DCMs for event-related responses measured with EEG or MEG use biologically informed models to make inferences about the underlying neuronal networks generating responses. The approach can be regarded as a neurobiologically constrained source reconstruction scheme, in which the parameters of the reconstruction have an explicit neuronal interpretation. Specifically, these parameters encode, among other things, the coupling among sources and how that coupling depends upon stimulus attributes or experimental context. The basic idea is to supplement conventional electromagnetic forward models of how sources are expressed in measurement space, with a model of how source activity is generated by neuronal dynamics. A single inversion of this extended forward model enables inference about both the spatial deployment of sources and the underlying neuronal architecture generating their signals. Left: This schematic shows a few sources that are coupled with extrinsic connections. Each source is modelled with three subpopulations (pyramidal, spiny-stellate and inhibitory interneurons). These have been assigned to granular and agranular cortical layers, which receive forward and backward connections respectively. Right: Source model with a layered architecture comprising three neuronal subpopulations, each with three states; voltage V(t)(j) and (excitatory and Inhibitory) conductances g(t)i(j):iI, E for the jth subpopulation. The neuronal state equations here are much more complicated than for fMRI (see Fig. 3). In this instance, they are based on a Morris–Lecar (Morris and Lecar, 1981) model and include random fluctuations on the neuronal states, Γ(t)i:iI,E (see Marreiros et al., 2009). The effects of these fluctuations can be modelled in terms of the dynamics of the ensuing probability distribution over the states of a population; this is known as a mean-field model. These models can be contrasted with neural-mass models that only consider the expected (mean) state of the population. In some instances, random fluctuations can have a marked effect on population dynamics (see Fig. 5).
Fig. 5
Fig. 5
Population dynamics and nested oscillations. Nested oscillations in the three-subpopulation source model shown in the previous figure (Fig. 4). The oscillations were elicited by a slow sinusoidal input for homologous mean-field and neural-mass (single source) models. The only difference between these models is that the dispersion or variance of states within each subpopulation is ignored in neural-mass models. This precludes dynamical interactions between the mean and dispersion of states and can lead to different dynamics. Exogenous input is shown in light blue, spiny interneuron depolarization in dark blue, inhibitory interneurons in green and pyramidal depolarization in red. The nonlinear interactions between voltage and conductance produces phase-amplitude coupling in the ensuing dynamics. This is a nonlinear phenomenon that couples different frequencies (see also Fig. 7). The MFM shows deeper oscillatory responses during the nested oscillations. See Marreiros et al. (2009) for details and further references.
Fig. 6
Fig. 6
Forward and backward connections (a DCM study of evoked responses). Neuronal responses to stimuli, measured electrophysiologically, unfold over several hundred milliseconds. Early or exogenous components are thought to reflect a perturbation of neuronal dynamics by (bottom-up) sensory inputs. Conversely, later endogenous components have been ascribed to (top-down) recurrent dynamics among hierarchical cortical levels. This example shows that late components of event-related responses are indeed mediated by backward connections. The evidence is furnished by dynamic causal modelling of auditory responses, elicited in an oddball paradigm using electroencephalography (EEG). Here, we consider the evidence for models with and without backward connections in data gathered over increasing windows of peristimulus time; to see whether backward connections are necessary to explain late components. Left (model specification and data): The upper graph shows the ERP responses to a deviant tone, from 0 to 400 ms peristimulus time (averaged over subjects). Sources comprising the DCM were connected with backward (grey) and/or forward (dark grey) connections as shown below. A1: primary auditory cortex, STG: superior temporal gyrus, IFG: inferior temporal gyrus. Two different models were tested, with and without backward connections (FB and F, respectively). Sources (estimated posterior moments and locations of equivalent dipoles) are superimposed on an MRI of a standard brain in MNI space (upper left). Right (Bayesian model selection): The upper graph shows the differences in log-evidence when comparing the model with backward connections (FB) against the model without (F). It shows that the evidence for the model with backward connections is substantially greater when, and only when, we consider the evidence in data, late in peristimulus time (after about 220 ms). The lower graphs show predicted (solid) and observed (broken) responses (of the principal spatial mode in channel space). The improved fit afforded by backward connections (for later components) is evident. This sort of result links a generic feature of brain responses with recurrent dynamics; which are a cornerstone of most modern theories of perceptual inference and learning. See Garrido et al. (2007b) for further details.
Fig. 7
Fig. 7
Forward and backward connections (a DCM study of induced responses). This example provides evidence for functional asymmetries between forward and backward connections that define hierarchical architectures in the brain. It exploits the fact that modulatory or nonlinear influences of one neuronal system on another (i.e., effective connectivity) entail coupling between different frequencies (see Fig. 5). Functional asymmetry is addressed here by comparing dynamic causal models of MEG responses induced by visual processing of faces. Bayesian model comparison indicated that the best model had nonlinear forward and backward connections. Under this model, there is a striking asymmetry between these connections; in which high (gamma) frequencies in higher cortical areas suppressed low (alpha) frequencies in lower areas. This suppression was significantly greater than the homologous coupling in the forward connections. These results highlight the importance of nonlinear coupling among brain regions and point to a functional asymmetry between forward and backward connections in cortical hierarchies. Left: (Above): Log-evidences (pooled over subjects) for four DCMs with different combinations of linear and nonlinear (N vs. L) coupling in forward and backward (F vs. B) connections. It can be seen that the best model is FNBN, which entails nonlinear coupling in both forward and backward connections. (Below): Location of the four sources (in MNI coordinates) and basic connectivity structure of the models. LV and RV: left and right occipital face area; LF and RF: left and right fusiform face area. Right: (Above): SPM of the t-statistic (p > 0.05 uncorrected) testing for a greater suppressive effect of backward connections, relative to forward connections (over subjects and hemisphere). (Below): Subject and hemisphere-specific estimates of the coupling strengths at the maximum of the SPM (red arrow). See Chen et al. (2009) for further details.

Similar articles

Cited by

References

    1. Abbott L.F., Varela J.A., Sen K., Nelson S.B. (1997). Synaptic depression and cortical gain control. Science. 1997 Jan 10;275(5297):220–224. - PubMed
    1. Achard S., Salvador R., Whitcher B., Suckling J., Bullmore E. A resilient, low-frequency, small-world human brain functional network with highly connected association cortical hubs. J. Neurosci. 2006;26(1):63–72. - PMC - PubMed
    1. Acs F., Greenlee M.W. Connectivity modulation of early visual processing areas during covert and overt tracking tasks. NeuroImage. 2008;41:380–388. - PubMed
    1. Allen P., Mechelli A., Stephan K.E., Day F., Dalton J., Williams S., McGuire P.K. Fronto-temporal interactions during overt verbal initiation and suppression. J. Cogn. Neurosci. 2008;20:1656–1669. - PubMed
    1. Alstott J., Breakspear M., Hagmann P., Cammoun L., Sporns O. Modeling the impact of lesions in the human brain. PLoS Comput. Biol. Jun. 2009;5(6):e1000408. - PMC - PubMed

Publication types

LinkOut - more resources