

The effects of TGF-alpha, IL-1beta and PDGF on fibroblast adhesion to ECM-derived matrix and KGF gene expression
- PMID: 20036421
- PMCID: PMC2813970
- DOI: 10.1016/j.biomaterials.2009.12.018
The effects of TGF-alpha, IL-1beta and PDGF on fibroblast adhesion to ECM-derived matrix and KGF gene expression
Abstract
The goal of this study was to elucidate the control mechanisms by which exogenous proteins regulate keratinocyte growth factor (KGF) expression in fibroblasts adhered to differing substrates and thereby provide insights into both fundamental in vitro cell signaling and cell-biomaterial interaction research. A serum-free culture system in which cells maintained their proliferative capacity was established and employed. The addition of transforming growth factor- alpha (TGF-alpha), interleukin-1beta (IL-1beta) and platelet-derived growth factor-BB (PDGF-BB) individually showed no effect on KGF protein release, however, IL-1beta addition led to increased KGF mRNA transcription, intracellular KGF protein synthesis, and granulocyte-macrophage colony-stimulating factor (GM-CSF) release. Intracellular KGF protein synthesis and extracellular release were enhanced when fibroblasts were treated with a combination of IL-1beta and PDGF-BB which suggests KGF synthesis and release are largely regulated by synergistic mechanisms. Surface-bound fibronectin-derived ligands and individual exogenous proteins promoted fibroblast adhesion to semi-interpenetrating polymer networks (sIPNs) but did not stimulate KGF release despite enhancement of KGF mRNA transcription. Additionally, serum conditioning was found to have a significant impact on KGF synthesis and the subsequent mechanisms controlling KGF release. This study demonstrates that KGF release from fibroblasts is likely regulated by multiple mechanisms involving post-transcriptional and exocytic controls which may be impacted by the presence of serum and how serum is removed from the in vitro cell environment.
Copyright 2009 Elsevier Ltd. All rights reserved.
Figures
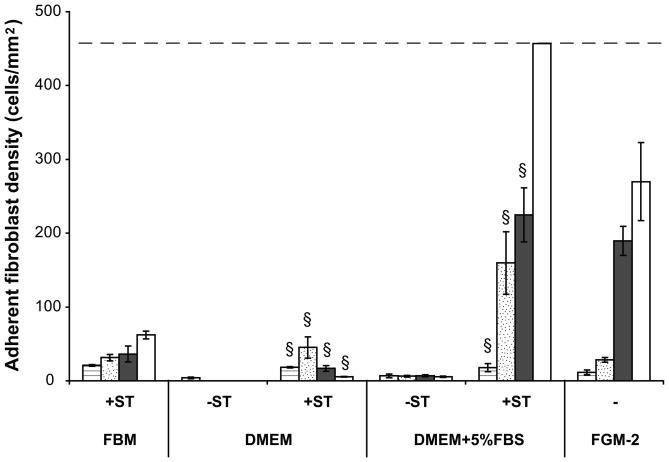
 ), 72 (
 ), 120 (
 ) and 168 (□) hours. Complete growth medium FGM-2 served as a control. All data presented as average ± standard deviation (n=3). Dashed line represents the cell confluency. §: Significantly different compared to cells without transitioning at the same time point, p<0.05.
 ), FBM+2% FBS (), FBM+5%FBS (), and FGM-2 (□). Serially transitioned cells were cultured on TCPS in serum-free and serum-containing media. FGM-2 served as a positive control using cells which did not undergo serial transitioning. KGF concentrations in cell culture supernatant from 24 to 168 hours were measured by ELISA. All data presented as average ± standard deviation (n=3). ‡: Significantly different compared to FBM+2%FBS, FBM+5%FBS, and FGM-2 at the same time point, p < 0.05. §: Significantly different compared to FBM+5%FBS, and FGM-2 at the same time point, p < 0.05. ¤: Significantly different compared to FGM-2 at the same time point, p < 0.05.
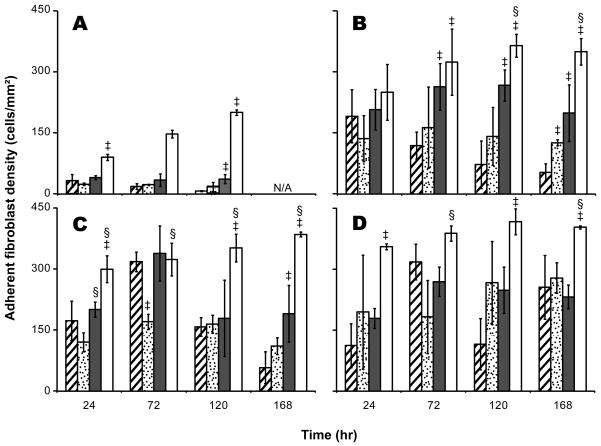
 ), GGG-modified sIPN (
 ), RGD-modified sIPN () and TCPS (□) at 24, 72, 120 and 168 hours in FBM supplemented with no exogenous protein (A), 10ng/mL TGF-α (B), 10ng/mL IL-1β (C), and 10ng/mL PDGF-BB (D). Cells were stained with LIVE/DEAD fluorescent assay kit and observed under microscope at 10× magnification. Images were recorded for cell counting. Five images per sample were taken at random fields of view. All data presented as average ± standard deviation (n=3). ‡: Significantly different compared to unmodified-sIPN with treatment by the same exogenous protein, p < 0.05. §: Significantly different compared to GGG-sIPN with treatment by the same exogenous protein, p < 0.05. N/A: Data not collected for that time point.
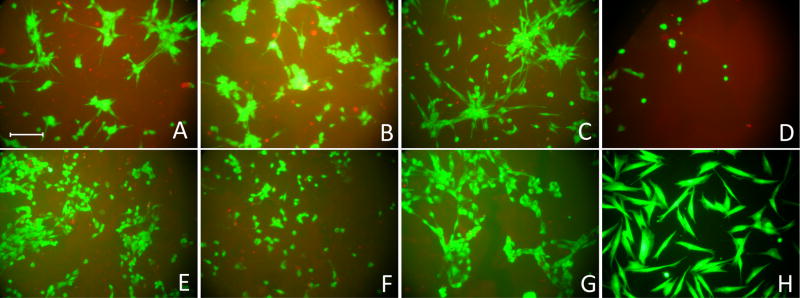
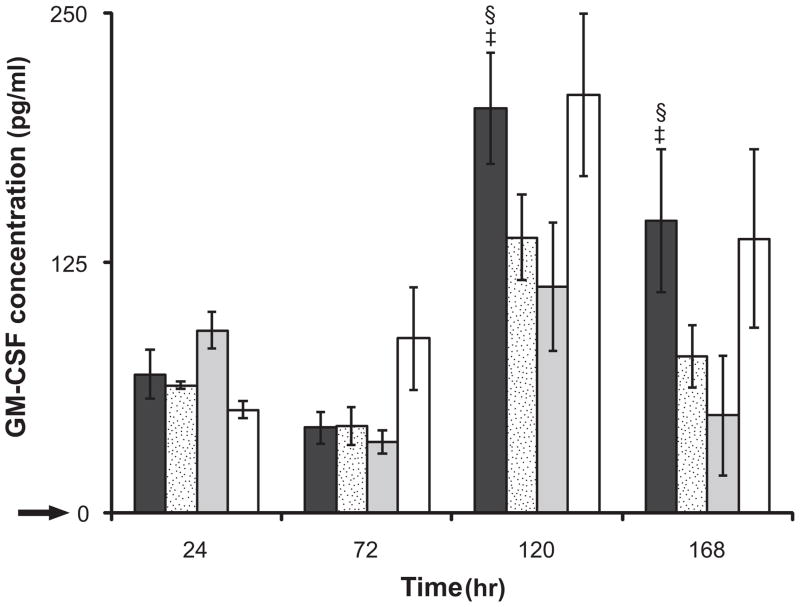 ), RGD-modified sIPN (), unmodified gelatin sIPN (
 ) and TCPS (□).
  represents the GM-CSF release from fibroblasts cultured on TCPS in FBM without supplemented IL-1β. All data presented as average ± standard deviation (n=3). §: Significantly different compared to unmodified sIPN, p<0.05. ‡: Significantly different compared to RGD modified sIPN, p<0.05;
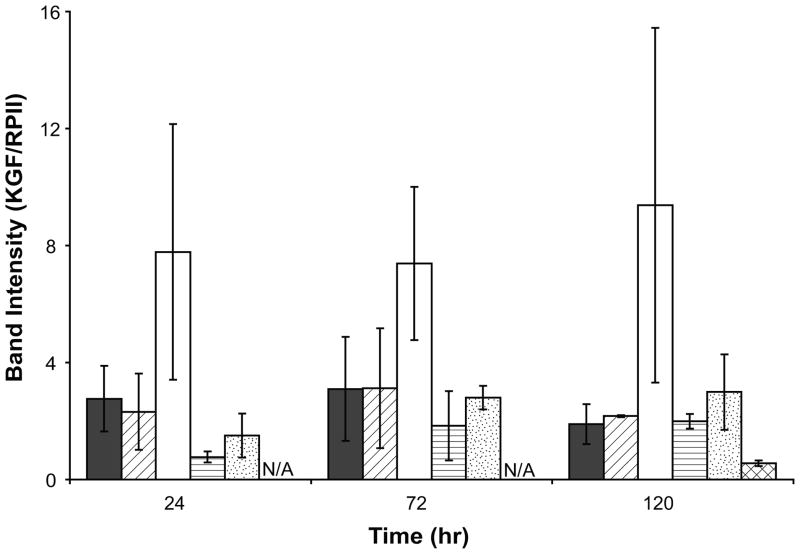 ), FBM+5%FBS (
 ) and FBM+10ng/mL IL-1β (□) on TCPS; in FBM (
 ) and FBM+10ng/mL IL-1β () on unmodified sIPN as well as in FBM on RGD-modified sIPN (
 ) at 24, 72 and 120 hours presented as the ratio between KGF and RPII band intensities. KGF and RPII band intensities were measured by ImageJ software version 1.32j. FBM+5%FBS served as a control. All data presented as average ± standard deviation (n=3 for TCPS and RGD-modified sIPN samples; n=2 for unmodified sIPN samples). N/A: data not collected for that time point.
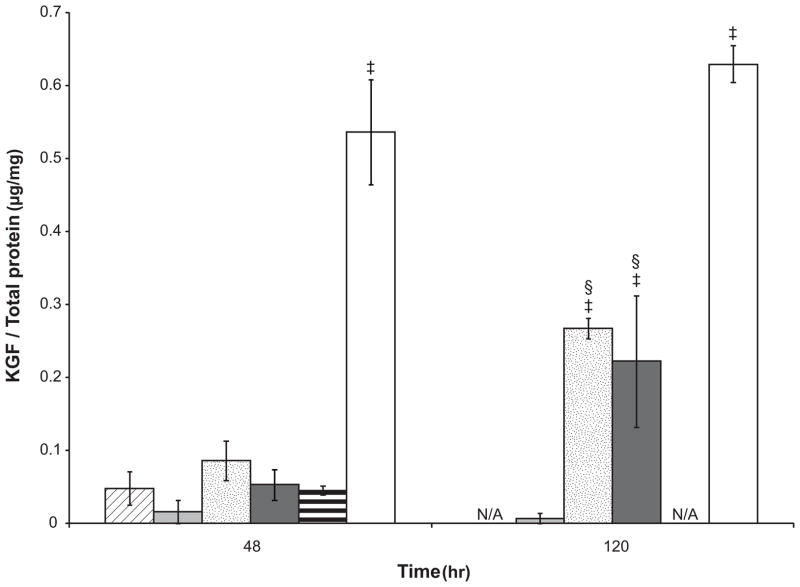 ), FBM (), FBM+5% FBS (), FBM+10ng/mL IL-1β (), FGM-2 (
 ) and FBM+10ng/mL IL-1β+10ng/mL PDGF-BB (□). FBM+5%FBS and FGM-2 served as controls. Cells were seeded in 6-well plates and lysed by M-PER with protease inhibitor at 48 and 120 hours. The KGF concentration in cell lysate was measured by ELISA and the total protein concentration was quantified by a BCA assay. The KGF protein expression was presented as the ratio of KGF to total cell protein. All data presented as average ± standard deviation (n=3). ‡: compared to FBM with adaptation at the same time point, p<0.05; §: compared to the same culture medium at 48 hours, p<0.05. N/A: Data not collected for that media.
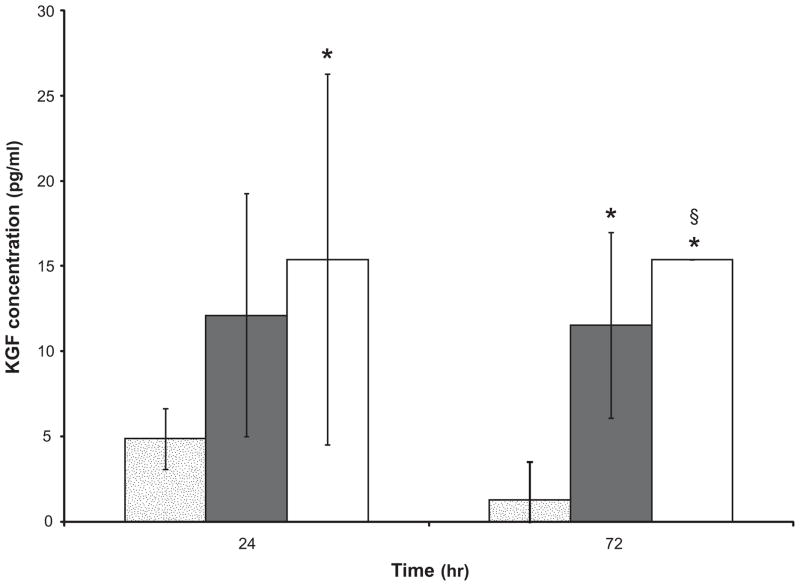 ) and with FBM+10ng/mL IL-1β () as well as on RGD-modified sIPN with FBM (□). Cells were seeded onto sIPNs which were fitted into 48-well plates. Cells were then lysed by M-PER with protease inhibitor at 24 and 72 hours. KGF concentrations were measured by ELISA. All data presented as average ± standard deviation. §: significantly different compared to unmodified sIPN when cells were cultured in FBM, p<0.05. *: sample size n=2, otherwise n=3.
Similar articles
-
Fibroblasts regulate monocyte response to ECM-derived matrix: the effects on monocyte adhesion and the production of inflammatory, matrix remodeling, and growth factor proteins.J Biomed Mater Res A. 2009 Jun 15;89(4):841-53. doi: 10.1002/jbm.a.32431. J Biomed Mater Res A. 2009. PMID: 19437738 Free PMC article.
-
Modulation of the keratinocyte-fibroblast paracrine relationship with gelatin-based semi-interpenetrating networks containing bioactive factors for wound repair.J Biomater Sci Polym Ed. 2009;20(7-8):1005-30. doi: 10.1163/156856209X444402. J Biomater Sci Polym Ed. 2009. PMID: 19454166 Free PMC article.
-
Differential regulation of keratinocyte growth factor and hepatocyte growth factor/scatter factor by different cytokines in human corneal and limbal fibroblasts.J Cell Physiol. 1997 Sep;172(3):361-72. doi: 10.1002/(SICI)1097-4652(199709)172:3<361::AID-JCP10>3.0.CO;2-9. J Cell Physiol. 1997. PMID: 9284956
-
Keratinocyte growth factor and scatter factor expression by regionally defined oral fibroblasts.Eur J Oral Sci. 2003 Feb;111(1):42-50. doi: 10.1034/j.1600-0722.2003.00002.x. Eur J Oral Sci. 2003. PMID: 12558807
-
Differential regulation of cytokine and receptor transcript expression in human corneal and limbal fibroblasts by epidermal growth factor, transforming growth factor-alpha, platelet-derived growth factor B, and interleukin-1 beta.Invest Ophthalmol Vis Sci. 1996 Sep;37(10):2068-80. Invest Ophthalmol Vis Sci. 1996. PMID: 8814146
Cited by
-
Effect of the addition of a labile gelatin component on the degradation and solute release kinetics of a stable PEG hydrogel.J Biomater Sci Polym Ed. 2012;23(12):1595-611. doi: 10.1163/092050611X587547. Epub 2012 May 11. J Biomater Sci Polym Ed. 2012. PMID: 21801489 Free PMC article.
-
Skin wound healing modulation by macrophages.Int J Clin Exp Pathol. 2010 Jul 25;3(7):643-53. Int J Clin Exp Pathol. 2010. PMID: 20830235 Free PMC article. Review.
-
3D cell entrapment in crosslinked thiolated gelatin-poly(ethylene glycol) diacrylate hydrogels.Biomaterials. 2012 Jan;33(1):48-58. doi: 10.1016/j.biomaterials.2011.09.031. Epub 2011 Sep 28. Biomaterials. 2012. PMID: 21955690 Free PMC article.
-
The cell-fate decision of dental follicle stem cells (DFSCs) with porcine corneal extracellular matrix (ECM).J Dent Sci. 2025 Jul;20(3):1605-1614. doi: 10.1016/j.jds.2025.02.019. Epub 2025 Mar 6. J Dent Sci. 2025. PMID: 40654417 Free PMC article.
-
A synthetic substrate to support early mesodermal differentiation of human embryonic stem cells.Biomaterials. 2011 Nov;32(32):8058-66. doi: 10.1016/j.biomaterials.2011.07.052. Epub 2011 Aug 6. Biomaterials. 2011. PMID: 21821284 Free PMC article.
References
-
- Finch PW, Rubin JS. Keratinocyte growth factor/fibroblast growth factor 7, a homeostatic factor with therapeutic potential for epithelial protection and repair. Adv Cancer Res. 2004;91:69–136. - PubMed
-
- Werner S, Krieg T, Smola H. Keratinocyte-fibroblast interactions in wound healing. J Invest Dermatol. 2007;127:998–1008. - PubMed
-
- Mass-Szabowski N, Shimotoyodome A, Fusenig NE. Keratinocyte growth regulation in fibroblast cocultures via a double paracrine mechanism. J Cell Sci. 1999;112:1843–1853. - PubMed
Publication types
MeSH terms
Substances
Grants and funding
LinkOut - more resources
Full Text Sources
