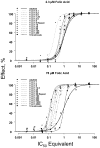
Comparison of methods for evaluating drug-drug interaction
- PMID: 20036874
- PMCID: PMC2885905
- DOI: 10.2741/e86
Comparison of methods for evaluating drug-drug interaction
Abstract
The goal of the present report is to compare several published methods of analyzing drug-drug interaction data. The compared methods are the curve-shift analysis, isobologram, combination index, and universal surface response analysis, and the comparison was based on analysis of published cytotoxicity data of combinations of two anti-folate agents. Major findings are as follows. The curve shift analysis enabled the inspection of the experimental data and visual evaluation of the approximate parallelism between the dose response curves. Isobologram analysis provided the range of concentration ratios where maximal synergy was obtained. The combination index analysis readily provided quantitative estimation of the extent of synergy or antagonism. The universal surface response method summarized drug-drug interaction in a single parameter, facilitating comparison of larger arrays of combinations. Only the curve shift analysis and the universal surface response method yielded a statistical estimate of differentiation between synergy, additivity, and antagonism. In summary, curve shift analysis, isobolograms, combination index analysis, and the universal response surface method are useful methods for analyzing drug-drug interaction, and provide complementary information.
Figures


Similar articles
-
Comparison of methods for statistical analysis of combination studies.Front Biosci (Elite Ed). 2010 Jan 1;2(1):250-7. doi: 10.2741/e87. Front Biosci (Elite Ed). 2010. PMID: 20036875
-
Application and review of the separate ray model to investigate interaction effects.Front Biosci (Elite Ed). 2010 Jan 1;2(1):266-78. doi: 10.2741/e89. Front Biosci (Elite Ed). 2010. PMID: 20036877
-
Applying Emax model and bivariate thin plate splines to assess drug interactions.Front Biosci (Elite Ed). 2010 Jan 1;2(1):279-92. doi: 10.2741/e90. Front Biosci (Elite Ed). 2010. PMID: 20036878 Free PMC article.
-
A review of synergy concepts of nonlinear blending and dose-reduction profiles.Front Biosci (Schol Ed). 2010 Jan 1;2(2):483-503. doi: 10.2741/s80. Front Biosci (Schol Ed). 2010. PMID: 20036963 Review.
-
Folic acid supplementation and malaria susceptibility and severity among people taking antifolate antimalarial drugs in endemic areas.Cochrane Database Syst Rev. 2022 Feb 1;2(2022):CD014217. doi: 10.1002/14651858.CD014217. Cochrane Database Syst Rev. 2022. PMID: 36321557 Free PMC article.
Cited by
-
Paclitaxel improved anti-L1CAM lutetium-177 radioimmunotherapy in an ovarian cancer xenograft model.EJNMMI Res. 2014 Dec;4(1):54. doi: 10.1186/s13550-014-0054-2. Epub 2014 Oct 3. EJNMMI Res. 2014. PMID: 26116117 Free PMC article.
-
Adrenomedullin blockade suppresses sunitinib-resistant renal cell carcinoma growth by targeting the ERK/MAPK pathway.Oncotarget. 2016 Sep 27;7(39):63374-63387. doi: 10.18632/oncotarget.11463. Oncotarget. 2016. PMID: 27556517 Free PMC article.
-
Vorinostat synergizes with ridaforolimus and abrogates the ridaforolimus-induced activation of AKT in synovial sarcoma cells.BMC Res Notes. 2014 Nov 18;7:812. doi: 10.1186/1756-0500-7-812. BMC Res Notes. 2014. PMID: 25406429 Free PMC article.
-
Exploring Phytochemical Adjuvant Therapy in Melanoma Treatment: The Effects of MAZ-51 and Zingerone on Melanoma Cell Proliferation.Clin Exp Pharmacol Physiol. 2025 Sep;52(9):e70059. doi: 10.1111/1440-1681.70059. Clin Exp Pharmacol Physiol. 2025. PMID: 40695356 Free PMC article.
-
Pharmacokinetics of antifungal drugs: practical implications for optimized treatment of patients.Infection. 2017 Dec;45(6):737-779. doi: 10.1007/s15010-017-1042-z. Epub 2017 Jul 12. Infection. 2017. PMID: 28702763 Free PMC article. Review.
References
-
- Danhof M, de Jongh J, De Lange EC, Della Pasqua O, Ploeger BA, Voskuyl RA. Mechanism-based pharmacokinetic-pharmacodynamic modeling: biophase distribution, receptor theory, and dynamical systems analysis. Annu Rev Pharmacol Toxicol. 2007;47:357–400. - PubMed
-
- Berenbaum MC. The expected effect of a combination of agents: the general solution. J Theor Biol. 1985;114:413–431. - PubMed
-
- Greco WR, Faessel H, Levasseur L. The search for cytotoxic synergy between anticancer agents: a case of Dorothy and the ruby slippers? J Natl Cancer Inst. 1996;88:699–700. - PubMed
-
- Loewe S, Muchnik H. Effect of combinations: mathematical basis of problem. Arch Exp Pathol Pharmacol. 1926:313–326.
-
- Berenbaum MC. What is synergy? Pharmacol Rev. 1989;41:93–141. - PubMed
Publication types
MeSH terms
Substances
Grants and funding
LinkOut - more resources
Full Text Sources
Other Literature Sources
Medical

