. 2010 Jan 1;2(1):279-92.
doi: 10.2741/e90.

Applying Emax model and bivariate thin plate splines to assess drug interactions

Affiliations

Applying Emax model and bivariate thin plate splines to assess drug interactions

Maiying Kong et al. Front Biosci (Elite Ed). .

Abstract

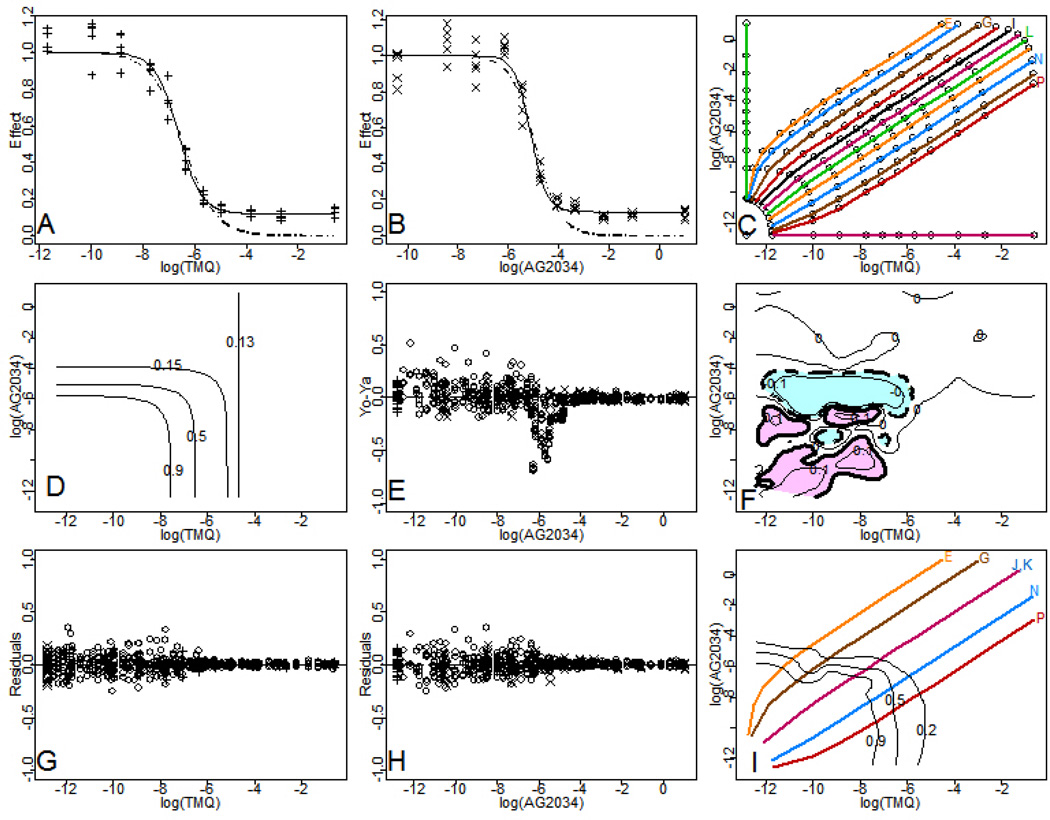
We review the semiparametric approach previously proposed by Kong and Lee and extend it to a case in which the dose-effect curves follow the Emax model instead of the median effect equation. When the maximum effects for the investigated drugs are different, we provide a procedure to obtain the additive effect based on the Loewe additivity model. Then, we apply a bivariate thin plate spline approach to estimate the effect beyond additivity along with its 95 per cent point-wise confidence interval as well as its 95 per cent simultaneous confidence interval for any combination dose. Thus, synergy, additivity, and antagonism can be identified. The advantages of the method are that it provides an overall assessment of the combination effect on the entire two-dimensional dose space spanned by the experimental doses, and it enables us to identify complex patterns of drug interaction in combination studies. In addition, this approach is robust to outliers. To illustrate this procedure, we analyzed data from two case studies.


Figures

Figure 1
Figure 1
Dose-effect curves. Panel A shows a typical curve with the maximum effect, Emax, less than 1. ED50 is the dose required to produce half of the maximum effect, E0–0.5Emax. Panel B shows two dose-effect curves with different maximum effects, say, Emax,1>Emax,2. In Panel B, drug 1 at dose level D1-Emax2,1 produces the maximum effect produced by drug 2 alone.
Figure 2
Figure 2
Additive isoboles. Panel A shows additive isobole under the Loewe additivity model. Any combination dose (d1, d2) on the line PQ¯ produces the same effect as drug 1 alone at dose Dy,1 (d1 + ρ(y)d2), or drug 2 alone at dose Dy,2 (ρ(y)1 d1+d2), y is the predicted effect for any combination dose at the line PQ¯, and ρ(y) is the relative potency at the effect level y. Panel B shows that the additive isoboles associated with the effect level in (1-Emax2, 1) cover the bound between the two solid vertical lines under the assumption Emax,1>Emax,2. Each dashed line corresponds to an isobole.
Figure 3
Figure 3
Analysis of the low FA experimental data. Panels A and B show the fitted marginal dose-effect curves for TMQ and AG2034 respectively, where the dotted-dashed line in each panel is the fitted dose-effect curve based on the median effect equation (E 3), while the solid line in each panel is the fitted dose-effect curve based on the Emax model (E 5). Panel C shows the distribution of the experimental doses and combination doses on the log (dose+δ) scale with δ=2.74 × 10⁻⁶, along with the 12 rays from left to right with dose ratios of TMQ versus AG2034 at 1:250, 1:125, 1:50, 1:20, 1:10, 1:5, 1:5, 2:5, 4:5, 2:1, 5:1, 10:1, denoted by the letters E, F, G, H, I, J, K, L, M, N, O, and P, representing the curves 15, 13, 11, 7, 5, 3, 9, 4, 6, 10, 12, and 14 in the original data set. Panel D shows the contour plot of the predicted additive effect, while Panel E shows the plot of the differences between the observed effects and the predicted effects versus the dose level of AG2034 on the log (dose+δ) scale. Panel F shows the contour plot of the fitted effect beyond the additivity effect at levels −0.1, 0, and 0.1 as thin solid lines, along with the intercept line of the 95% point-wise upper confidence surface with the dose plane as thick dashed lines and the intercept line of the 95% point-wise lower confidence surface with the dose plane as thick solid lines. In Panel F, the combination doses in the light blue area are synergistic, the combination doses in the light pink area are antagonistic, and the combination doses in the uncolored area are additive. The colored lines in Panels C and I are the design rays. Panels G and H are the plots of the final residuals versus TMQ and AG2034 on the log (dose+δ) scale, respectively, and Panel I is the contour plot of the fitted response surface at the levels of 0.9, 0.5, and 0.2, along with some representative design rays.
Figure 4
Figure 4
Different patterns of drug interactions for the low FA experimental data. Panel A is based on 95% point-wise confidence intervals; Panel B is based on 95% simultaneous confidence band. Panel A is the combination of Figures 3.F and 3.I, along with the design points shown as dots on each ray. Thin solid lines are contour lines of the fitted effect surface beyond the additivity surface at the levels of −0.1, 0, and 0.1; thick dashed lines are the intercept lines of the upper 95% point-wise confidence surface with the dose plane; thick solid lines are the intercept lines of the lower 95% point-wise confidence surface with the dose plane. The colored lines labeled E, G, J, K, N, and P are the representatives of the design rays. The red dotteddashed lines are the contour lines of the fitted response surface at the levels of 0.9, 0.5, and 0.2, respectively. Based on Panel A, the combination doses in the light blue area are synergistic, the combination doses in the light pink area are antagonistic, and the combination doses on the uncolored area are additive. Panel B presents the same information as Panel A except that the thick dashed lines are the intercept lines of the upper 95% simultaneous confidence surface with the dose plane and there are no intercept lines for the lower 95% simultaneous confidence surface with the dose plane. Based on Panel B, the combination doses inside the dashed lines are synergistic, otherwise additive. Panel B gives more conservative results for assessing drug interactions. Panels C and D are the results from fitting the data set excluding outliers for the low FA experiment, where the information in Panel C is parallel to that in Panel A, and the information in Panel D is parallel to that in Panel B.
Figure 5
Figure 5
Analysis of the high FA experimental data. Panels A and B show the fitted marginal dose-effect curves for TMQ and AG2034 respectively; the dotted-dashed line is the fitted dose-effect curve based on the median effect equation (E 3); the solid line is the fitted dose-effect curve based on the Emax model (E 5). Panel C shows the distribution of the experimental doses and combination doses on the log(dose+δ) scale with δ=2.74 × 10⁻⁶, along with the 12 rays (left to right) with dose ratios of TMQ versus AG2034 at 1:2500, 1:1250, 1:500, 1:200, 1:100, 1:50, 1:50, 1:25, 1:12.5, 1:5, 1:2, 1:1, denoted by the letters E, F, G, H, I, J, K, L, M, N, O, P, representing the curves 15, 13, 11, 7, 5, 3, 9, 4, 6, 10, 12, 14 in the original data set. Panel D shows the contour plot of the predicted additive effect. Panel E shows the plot of the differences between the observed effects and the predicted effects versus the dose level of AG2034 on the log(dose+δ) scale. Panel F shows the contour plot of the fitted effect beyond the additivity effect at levels −0.1, 0, and 0.1, along with the intercept line of the upper 95% point-wise confidence surface with the dose plane as thick dashed lines and the intercept lines of the lower 95% point-wise confidence surface with the dose plane as thick solid lines. In Panel F, synergistic combination doses are in light blue; antagonistic combination doses are in light pink; additive combination doses are in the uncolored area. The colored lines in Panels C and I represent the design rays. Panels G and H are the plots of the final residuals versus TMQ and AG2034 on the log(dose+δ) scale, respectively. Panel I is the contour plot of the fitted response surface at the levels of 0.9, 0.5, and 0.15, along with some representative design rays.
Figure 6
Figure 6
Different patterns of drug interactions for the high FA experiment. Panel A is based on 95% point-wise confidence intervals; Panel B is based on 95% simultaneous confidence band. Panel A is the combination of Figures 5.F and I, along with the design points shown as dots on each ray. Thin solid lines are contour lines of the fitted effect surface beyond the additivity surface at the levels of −0.1, 0, and 0.1; thick dashed lines are the intercept lines of the upper 95% point-wise confidence surface with the dose plane; thick solid lines are the intercept lines of the lower 95% point-wise confidence surface with the dose plane. The colored lines labeled E, G, J, K, N, and P represent the design rays; red dotted-dashed lines are the contour lines of the fitted response surface at the levels of 0.9, 0.5, and 0.15. In Panel A, the synergistic combination doses are in light blue; the antagonistic combination doses are in light pink; additive combination doses in the uncolored area. Panel B gives the same information as Panel A except that the thick dashed lines are the intercept lines of the upper 95% simultaneous confidence surface with the dose plane. Based on Panel B, the combination doses inside the dashed lines are synergistic, otherwise additive. Panel B gives more conservative results for assessing drug interactions. Panels C and D are the results excluding outliers, and are parallel to the results in Panels A and B, respectively.

Similar articles

Cited by

References

    1. Kanzawa Fumihiko, Nishio Kazuto, Fukuoka Kazuya, Sunami Toshihiko, Saijo Nagahiro. In vitro interactions of a new derivative of spicamycin, KRN5500, and other anticancer drugs using a three-dimensional model. Cancer Chemother Pharmacol. 1999;43:353–363. - PubMed
    1. Berenbaum Morris C. What is synergy? Pharmacol Rev. 1989;41:93–141. - PubMed
    1. Greco William R, Bravo Gregory, Parsons John C. The search of synergy: A critical review from a response surface perspective. Pharmacol Rev. 1995;47(2):331–385. - PubMed
    1. Chou Ting-Chao. Theoretical basis, experimental design, and computerized simulation of synergism and antagonism in drug combination studies. Pharmacol Rev. 2006;58:621–681. - PubMed
    1. Lee J Jack, Kong Maiying, Ayers Gregory D, Lotan Reuben. Interaction index and different methods for determining drug interaction in Combination Therapy. J Biopharm Stat. 2007;17:461–480. - PubMed

Publication types