Emax model and interaction index for assessing drug interaction in combination studies
- PMID: 20036904
- PMCID: PMC2974574
- DOI: 10.2741/e116
Emax model and interaction index for assessing drug interaction in combination studies
Abstract
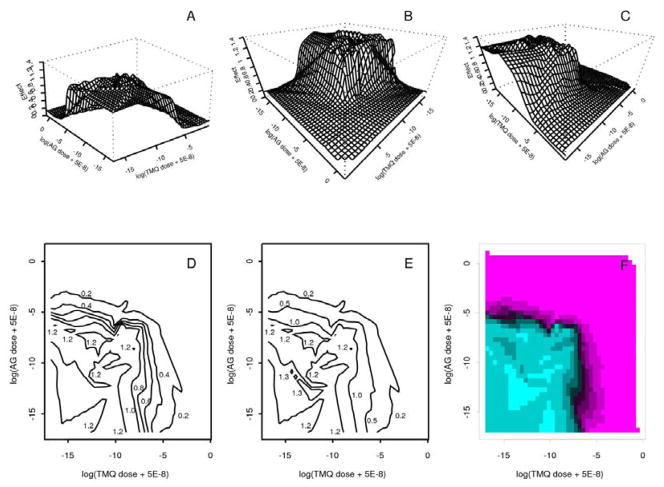
Applying the Emax model in a Lowe additivity model context, we analyze data from a combination study of trimetrexate (TMQ) and AG2034 (AG) in media of low and high concentrations of folic acid (FA). The Emax model provides a sufficient fit to the data. TMQ is more potent than AG in both low and high FA media. At low TMQ:AG ratios, when a smaller amount of the more potent drug (TMQ) is added to a larger amount of the less potent drug (AG), synergy results. When the TMQ:AG ratio reaches 0.4 or larger in low FA medium, or when the TMQ:AG ratio reaches 1 or larger in high FA medium, synergy is weakened and drug interaction becomes additive. In general, synergistic effect in a dilution series is stronger at higher doses that produce stronger effects (closer to 1-Emax) than at lower dose levels that produce weaker effects (closer to 1). The two drugs are more potent in the low compared to the high FA medium. Drug synergy, however, is stronger in the high FA medium.
Figures


Similar articles
-
Applying Emax model and bivariate thin plate splines to assess drug interactions.Front Biosci (Elite Ed). 2010 Jan 1;2(1):279-92. doi: 10.2741/e90. Front Biosci (Elite Ed). 2010. PMID: 20036878 Free PMC article.
-
Thymidine and hypoxanthine protection patterns of the folic acid-enhanced synergies for combinations of trimetrexate plus a polyglutamylatable inhibitor of purine or thymidylate synthesis against human ileocecal HCT-8 cells.Int J Oncol. 2003 Aug;23(2):401-9. Int J Oncol. 2003. PMID: 12851689
-
Folic acid-enhanced synergy for the combination of trimetrexate plus the glycinamide ribonucleotide formyltransferase inhibitor 4-[2-(2-amino-4-oxo-4,6,7,8-tetrahydro-3H-pyrimidino[5,4,6][1,4]thiazin -6-yl)-(S)-ethyl]-2,5-thienoylamino-L-glutamic acid (AG2034): comparison across sensitive and resistant human tumor cell lines.Biochem Pharmacol. 1999 Mar 1;57(5):567-77. doi: 10.1016/s0006-2952(98)00315-3. Biochem Pharmacol. 1999. PMID: 9952321
-
A review of synergy concepts of nonlinear blending and dose-reduction profiles.Front Biosci (Schol Ed). 2010 Jan 1;2(2):483-503. doi: 10.2741/s80. Front Biosci (Schol Ed). 2010. PMID: 20036963 Review.
-
Folic acid supplementation and malaria susceptibility and severity among people taking antifolate antimalarial drugs in endemic areas.Cochrane Database Syst Rev. 2022 Feb 1;2(2022):CD014217. doi: 10.1002/14651858.CD014217. Cochrane Database Syst Rev. 2022. PMID: 36321557 Free PMC article.
Cited by
-
Robust and Efficient Assessment of Potency (REAP) as a quantitative tool for dose-response curve estimation.Elife. 2022 Aug 3;11:e78634. doi: 10.7554/eLife.78634. Elife. 2022. PMID: 35921131 Free PMC article.
-
Confidence Intervals of Interaction Index for Assessing Multiple Drug Interaction.Stat Biopharm Res. 2009 Feb 1;1(1):4-17. doi: 10.1198/sbr.2009.0001. Stat Biopharm Res. 2009. PMID: 20037663 Free PMC article.
-
Applying Emax model and bivariate thin plate splines to assess drug interactions.Front Biosci (Elite Ed). 2010 Jan 1;2(1):279-92. doi: 10.2741/e90. Front Biosci (Elite Ed). 2010. PMID: 20036878 Free PMC article.
-
Multi-task learning for predicting synergistic drug combinations based on auto-encoding multi-relational graphs.iScience. 2023 Sep 22;26(10):108020. doi: 10.1016/j.isci.2023.108020. eCollection 2023 Oct 20. iScience. 2023. PMID: 37854693 Free PMC article.
References
-
- Rathbun R Chris, Lockhart Staci M, Stephens Johnny R. Current HIV treatment guidelines - an overview. Curr Pharm Des. 2006;12:1045–1063. - PubMed
-
- Molina Julian R, Adjei Alex A, Jett James R. Advances in chemotherapy of non-small cell lung cancer. Chest. 2006;130:1211–1219. - PubMed
-
- Nyunt Myaing M, Plowe Christopher V. Pharmacologic advances in the global control and treatment of malaria: combination therapy and resistance. Clin Pharmacol and Ther. 2007;82:601–605. - PubMed
-
- Sankhala Kamalesh K, Papadopoulos Kyriakos P. Future options for imatinib mesilate-resistant tumors. Expert Opinion Investig Drugs. 2007;16:1549–1560. - PubMed
-
- Bianco Roberto, Damiano Vincenzo, Gelardi Teresa, Daniele Gennaro, Ciardiello Fortunato, Tortora Giampaolo. Rational combination of targeted therapies as a strategy to overcome the mechanisms of resistance to inhibitors of EGFR signaling. Curr Pharm Des. 2007;13:3358–3367. - PubMed
Publication types
MeSH terms
Substances
Grants and funding
LinkOut - more resources
Full Text Sources
Medical