

Non-gaussian analysis of diffusion-weighted MR imaging in head and neck squamous cell carcinoma: A feasibility study
- PMID: 20037133
- PMCID: PMC2854270
- DOI: 10.3174/ajnr.A1919
Non-gaussian analysis of diffusion-weighted MR imaging in head and neck squamous cell carcinoma: A feasibility study
Abstract
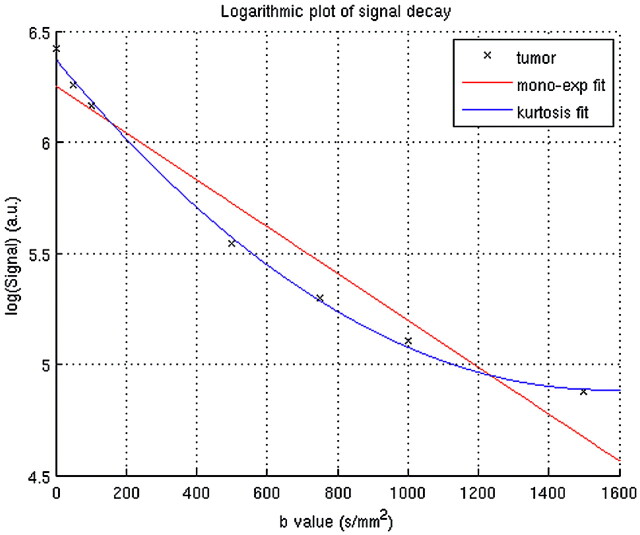
Background and purpose: Water in biological structures often displays non-Gaussian diffusion behavior. The objective of this study was to test the feasibility of non-Gaussian fitting by using the kurtosis model of the signal intensity decay curves obtained from DWI by using an extended range of b-values in studies of phantoms and HNSCC.
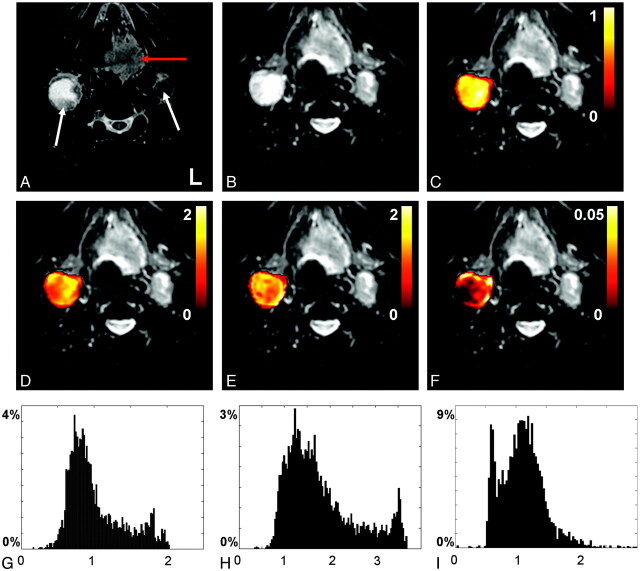
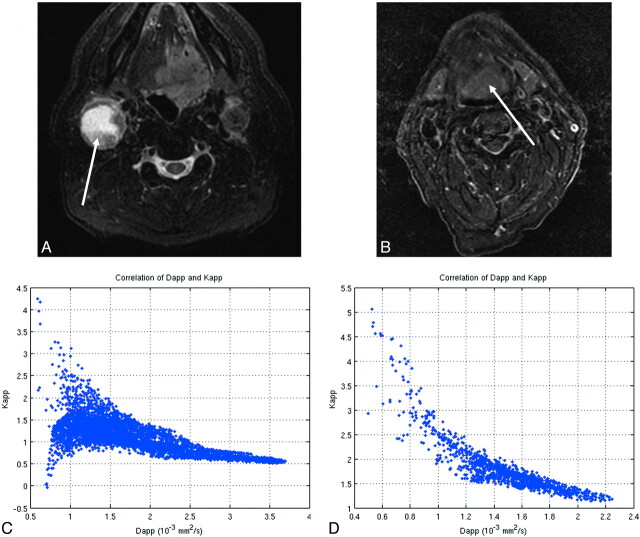
Materials and methods: Seventeen patients with HNSCC underwent DWI by using 6 b-factors (0, 50-1500 s/mm(2)) at 1.5T. Monoexponential (yielding ADC(mono)) and non-Gaussian kurtosis (yielding apparent diffusion coefficient D(app) and apparent kurtosis coefficient K(app)) fits were performed on a voxel-by-voxel basis in selected regions of interest (primary tumors, metastatic lymph nodes, and spinal cord). DWI studies were also performed on phantoms containing either water or homogenized asparagus. To determine whether the kurtosis model provided a significantly better fit than did the monoexponential model, an F test was performed. Spearman correlation coefficients were calculated to assess correlations between K(app) and D(app).
Results: The kurtosis model fit the experimental data points significantly better than did the monoexponential model (P < .05). D(app) was approximately twice the value of ADC(mono) (eg, in neck nodal metastases D(app) was 1.54 and ADC(mono) was 0.84). K(app) showed a weak Spearman correlation with D(app) in a homogenized asparagus phantom and for 44% of tumor lesions.
Conclusions: The use of kurtosis modeling to fit DWI data acquired by using an extended b-value range in HNSCC is feasible and yields a significantly better fit of the data than does monoexponential modeling. It also provides an additional parameter, K(app), potentially with added value.
Figures
Similar articles
-
Hybrid [¹⁸F]-FDG PET/MRI including non-Gaussian diffusion-weighted imaging (DWI): preliminary results in non-small cell lung cancer (NSCLC).Eur J Radiol. 2013 Nov;82(11):2055-60. doi: 10.1016/j.ejrad.2013.05.027. Epub 2013 Jul 5. Eur J Radiol. 2013. PMID: 23830904
-
Non-Gaussian analysis of diffusion weighted imaging in head and neck at 3T: a pilot study in patients with nasopharyngeal carcinoma.PLoS One. 2014 Jan 23;9(1):e87024. doi: 10.1371/journal.pone.0087024. eCollection 2014. PLoS One. 2014. PMID: 24466318 Free PMC article.
-
Diffusion-weighted MRI of the lung at 3T evaluated using echo-planar-based and single-shot turbo spin-echo-based acquisition techniques for radiotherapy applications.J Appl Clin Med Phys. 2019 Jan;20(1):284-292. doi: 10.1002/acm2.12493. Epub 2018 Nov 12. J Appl Clin Med Phys. 2019. PMID: 30421496 Free PMC article.
-
Diagnostic Performance of Monoexponential DWI Versus Diffusion Kurtosis Imaging in Prostate Cancer: A Systematic Review and Meta-Analysis.AJR Am J Roentgenol. 2018 Aug;211(2):358-368. doi: 10.2214/AJR.17.18934. Epub 2018 May 29. AJR Am J Roentgenol. 2018. PMID: 29812977
-
Body diffusion kurtosis imaging: Basic principles, applications, and considerations for clinical practice.J Magn Reson Imaging. 2015 Nov;42(5):1190-202. doi: 10.1002/jmri.24985. Epub 2015 Jun 26. J Magn Reson Imaging. 2015. PMID: 26119267 Review.
Cited by
-
New diffusion metrics for spondylotic myelopathy at an early clinical stage.Eur Radiol. 2012 Aug;22(8):1797-802. doi: 10.1007/s00330-012-2410-9. Epub 2012 Mar 13. Eur Radiol. 2012. PMID: 22411307 Free PMC article.
-
A fast schema for parameter estimation in diffusion kurtosis imaging.Comput Med Imaging Graph. 2014 Sep;38(6):469-80. doi: 10.1016/j.compmedimag.2014.06.010. Epub 2014 Jun 23. Comput Med Imaging Graph. 2014. PMID: 25016957 Free PMC article.
-
Nongaussian Intravoxel Incoherent Motion Diffusion Weighted and Fast Exchange Regime Dynamic Contrast-Enhanced-MRI of Nasopharyngeal Carcinoma: Preliminary Study for Predicting Locoregional Failure.Cancers (Basel). 2021 Mar 6;13(5):1128. doi: 10.3390/cancers13051128. Cancers (Basel). 2021. PMID: 33800762 Free PMC article.
-
Perfusion defects in non-enlarged metastatic lymph nodes using vessel wall magnetic resonance imaging: Detection performance and diagnostic value.Clin Exp Metastasis. 2022 Jun;39(3):421-431. doi: 10.1007/s10585-022-10147-w. Epub 2022 Feb 4. Clin Exp Metastasis. 2022. PMID: 35119560
-
Measurement of cellular-interstitial water exchange time in tumors based on diffusion-time-dependent diffusional kurtosis imaging.NMR Biomed. 2021 Jun;34(6):e4496. doi: 10.1002/nbm.4496. Epub 2021 Feb 25. NMR Biomed. 2021. PMID: 33634508 Free PMC article.
References
-
- Koh DM, Collins DJ. Diffusion-weighted MRI in the body: applications and challenges in oncology. AJR Am J Roentgenol 2007; 188: 1622–35 - PubMed
-
- Basser PJ, Jones DK. Diffusion-tensor MRI: theory, experimental design and data analysis—a technical review. NMR Biomed 2002; 15: 456–67 - PubMed
-
- Lu H, Jensen JH, Ramani A, et al. . Three-dimensional characterization of non-gaussian water diffusion in humans using diffusion kurtosis imaging. NMR Biomed 2006; 19: 236–47 - PubMed
-
- Karger J. NMR self-diffusion studies in heterogeneous systems. Adv Colloid Interface Sci 1985; 23: 129–48
-
- Niendorf T, Norris DG, Leibfritz D. Detection of apparent restricted diffusion in healthy rat brain at short diffusion times. Magn Reson Med 1994; 32: 672–77 - PubMed
MeSH terms
Grants and funding
LinkOut - more resources
Full Text Sources