. 2010 Mar;105(3):365-74.
doi: 10.1093/aob/mcp297. Epub 2009 Dec 25.

Effects of phosphorus supply on growth, phosphate concentration and cluster-root formation in three Lupinus species

Affiliations

Effects of phosphorus supply on growth, phosphate concentration and cluster-root formation in three Lupinus species

Ahmad Abdolzadeh et al. Ann Bot. 2010 Mar.

Abstract

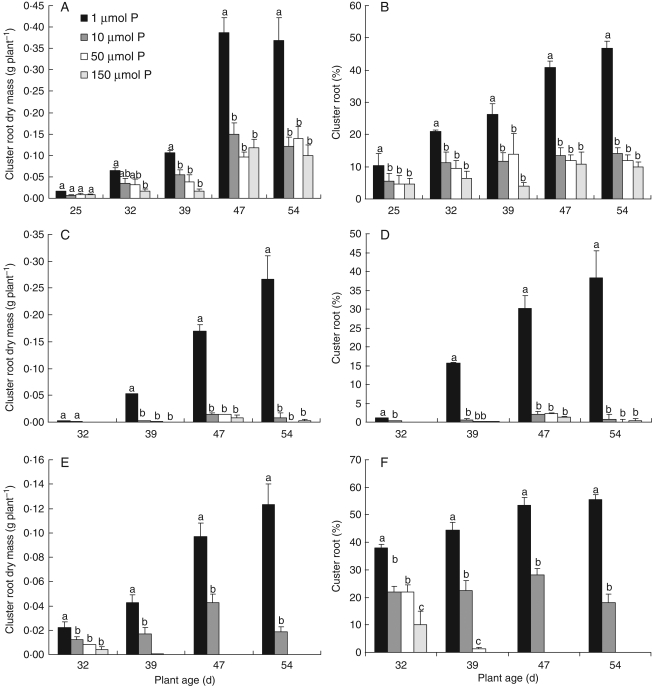
Background and aims: In some lupin species, phosphate deficiency induces cluster-root formation, which enhances P uptake by increasing root surface area and, more importantly, the release of root exudates which enhances P availability.

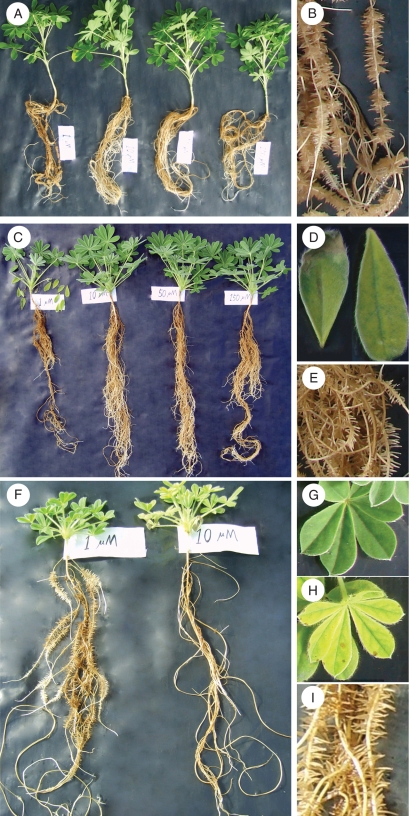
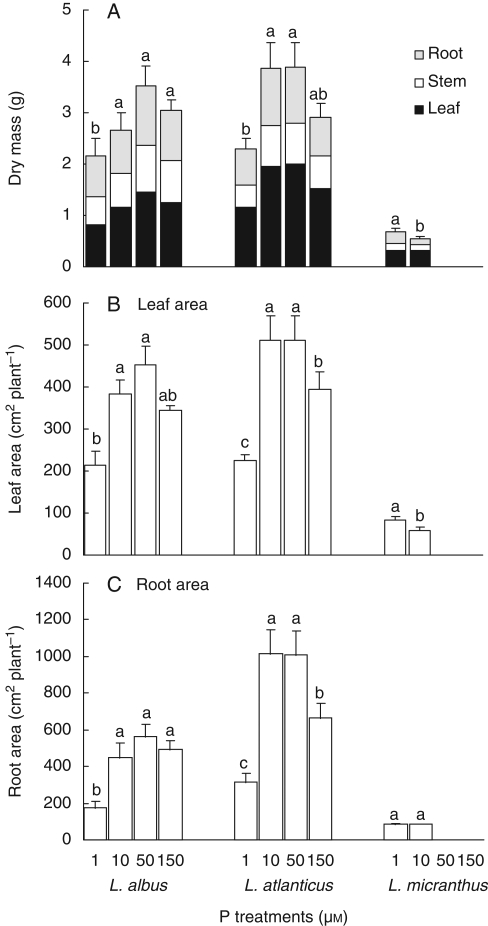
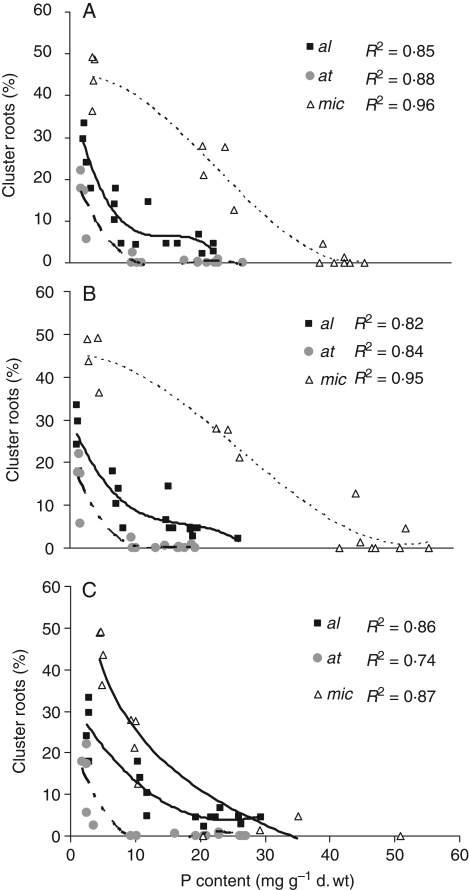
Methods: Three species of Lupinus, L. albus, L. atlanticus and L. micranthus, with inherently different relative growth rates were cultivated under hydroponics in a greenhouse at four phosphate concentrations (1, 10, 50 and 150 microm) to compare the role of internal P in regulating cluster-root formation.

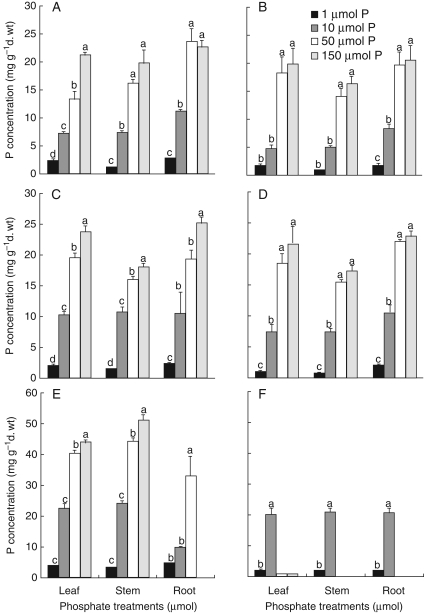
Key results: The highest growth rate was observed in L. atlanticus, followed by L. albus and L. micranthus. At 1 microm P, cluster-root formation was markedly induced in all three species. The highest P uptake and accumulation was observed in L. micranthus, followed by L. atlanticus and then L. albus. Inhibition of cluster-root formation was severe at 10 microm P in L. atlanticus, but occurred stepwise with increasing P concentration in the root medium in L. albus.

Conclusions: In L. atlanticus and L. albus cluster-root formation was suppressed by P treatments above 10 microm, indicating a P-inducible regulating system for cluster-root formation, as expected. By contrast, production of cluster roots in L. micranthus, in spite of a high internal P concentration, indicated a lower sensitivity to P status, which allowed P-toxicity symptoms to develop.


Figures

Fig. 1.
Fig. 1.
Effect of phosphate concentration in the root environment on plant growth. (A) Lupinus albus whole plants, (B) L. albus cluster root of a plant grown at 1 µm P, (C) L. atlanticus whole plants, (D) L. atlanticus leaves showing P deficiency, (E) L. atlanticus cluster root of a plant grown at 1 µk P, (F) L. micranthus plants, (G) L. micranthus healthy leaf of a plant grown at 1 µm P, (H) L. micranthus leaf showing P toxicity when plants are grown at 10 µm P and (I) L. micranthus cluster root of a plant grown at 1 µm P.
Fig. 2.
Fig. 2.
Effects of phosphate concentration in the root environment on dry mass (A), leaf area (B) and root area (C) of Lupinus albus, L. atlanticus and L. micranthus plants after 54 d in hydroponics. Treatment means marked with the same lower-case letter are not significantly different within each group using a one-way ANOVA for each harvest followed by Duncan's multiple test (P < 0·05).
Fig. 3.
Fig. 3.
Effects of phosphate concentration in the root environment on cluster-root dry mass and percentage of cluster roots as compared with total roots based on dry mass in Lupinus species during 54 d in hydroponics. L. albus (A, B), L. atlanticus (C, D) and L. micranthus (E, F). Treatment means marked with the same lower-case letter are not significantly different within each group using a one-way ANOVA for each harvest followed by Duncan's multiple test (P < 0·05).
Fig. 4.
Fig. 4.
Effects of phosphate concentration in the root environment on P concentration in Lupinus species during 54 d of hydroponics culture. L. albus day 39 (A), L. albus day 54 (B), L. atlanticus day 39 (C), L. atlanticus day 54 (D), L. micranthus day 39 (E), L. micranthus day 54 (F). Treatment means marked with the same lower-case letter are not significantly different within each group using a one-way ANOVA for each harvest followed by Duncan's multiple test (P < 0·05).
Fig. 5.
Fig. 5.
Relationship between percentage of cluster roots as compared with total roots (based on dry mass) and phosphate concentration in leaves (A), stems (B) and roots (C) of Lupinus species. L. albus = al, L. atlanticus = at and L. micranthus = mic.

Similar articles

Cited by

References

    1. Bari R, Pant BD, Stitt M, Scheible WR. PHO2, micro-RNA399, and PHR1 define a phosphate-signaling pathway in plants. Plant Physiology. 2006;141:988–999. - PMC - PubMed
    1. Bolland MDA, Siddique KHM, Loss SP, Baker MJ. Comparing responses of grain legumes, wheat and canola to applications of superphosphate. Nutrient Cycling in Agroecosystems. 1999;53:157–175.
    1. Cordell D, Drangert J-O, White S. The story of phosphorus: global food security and food for thought. Global Environmental Change. 2009;19:292–305.
    1. Curtin D, Syers JK, Bolan NS. Phosphate sorption by soil in relation to exchangeable cation composition and pH. Australian Journal of Soil Research. 1993;31:137–149.
    1. Fujii H, Chiou T, Lin S, Aung K, Zhu J. A miRNA involved in phosphate-starvation response in Arabidopsis. Current Biology. 2005;15:2038–2043. - PubMed