. 2010 Mar 12;285(11):8061-75.
doi: 10.1074/jbc.M109.087866. Epub 2009 Dec 26.

Abrogation of glucocorticoid receptor dimerization correlates with dissociated glucocorticoid behavior of compound a

Affiliations

Abrogation of glucocorticoid receptor dimerization correlates with dissociated glucocorticoid behavior of compound a

Steven Robertson et al. J Biol Chem. .

Abstract

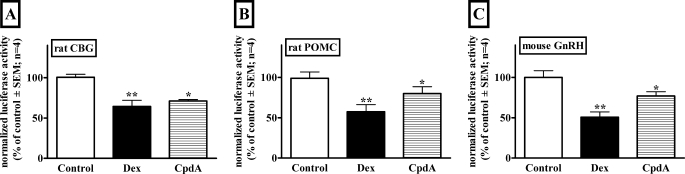
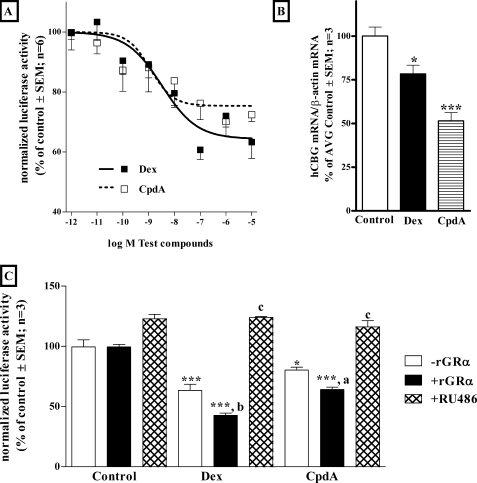
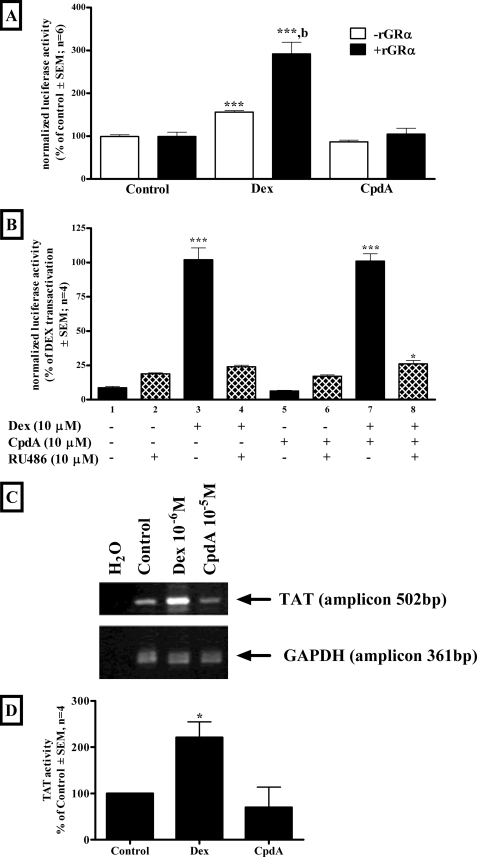
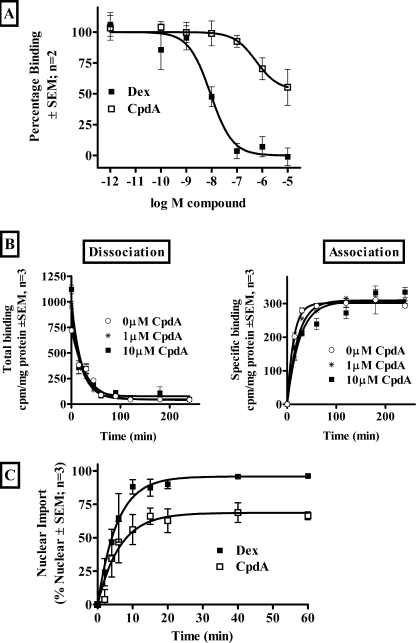
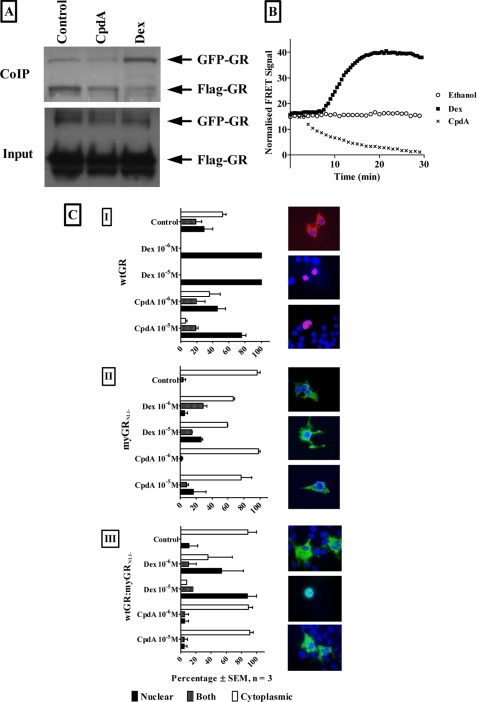
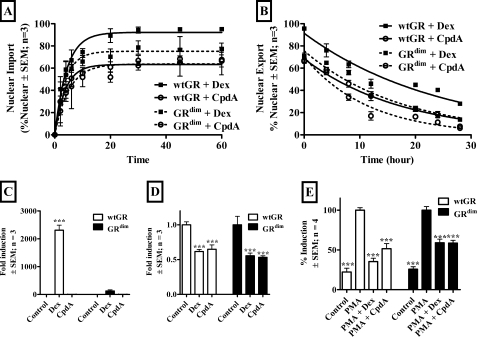
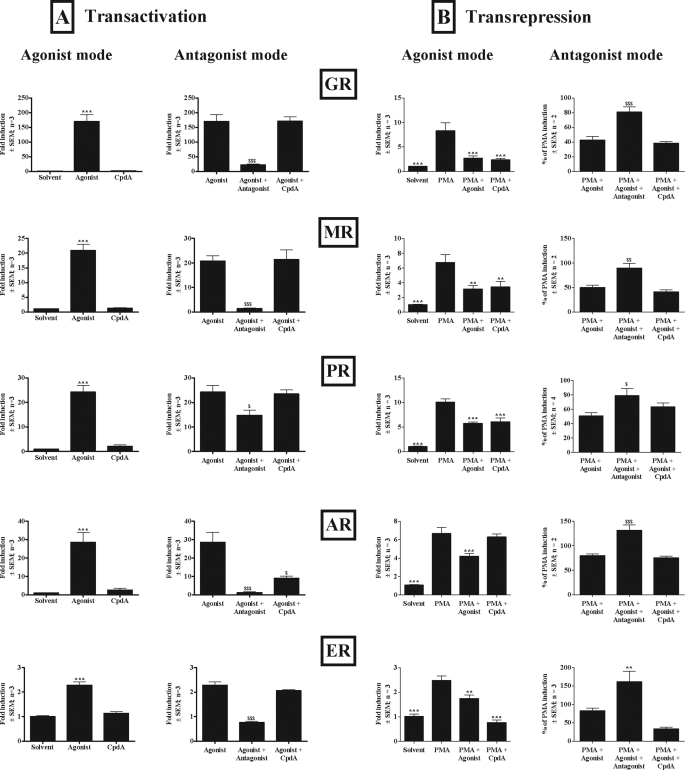
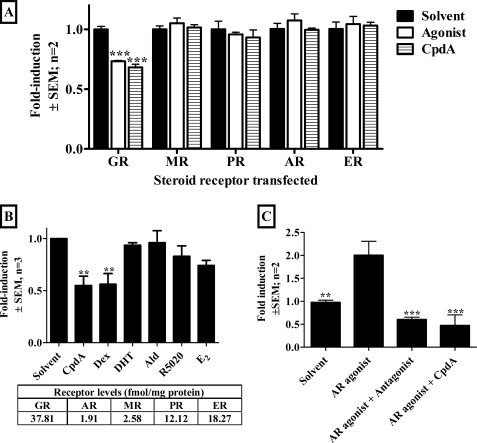
Compound A (CpdA), a dissociated glucocorticoid receptor modulator, decreases corticosteroid-binding globulin (CBG), adrenocorticotropic hormone (ACTH), and luteneinizing hormone levels in rats. Whether this is due to transcriptional regulation by CpdA is not known. Using promoter reporter assays we show that CpdA, like dexamethasone (Dex), directly transrepresses these genes. Results using a rat Cbg proximal-promoter reporter construct in BWTG3 and HepG2 cell lines support a glucocorticoid receptor (GR)-dependent transrepression mechanism for CpdA. However, CpdA, unlike Dex, does not result in transactivation via glucocorticoid-responsive elements within a promoter reporter construct even when GR is co-transfected. The inability of CpdA to result in transactivation via glucocorticoid-responsive elements is confirmed on the endogenous tyrosine aminotransferase gene, whereas transrepression ability is confirmed on the endogenous CBG gene. Consistent with a role for CpdA in modulating GR activity, whole cell binding assays revealed that CpdA binds reversibly to the GR, but with lower affinity than Dex, and influences association of [(3)H]Dex, but has no effect on dissociation. In addition, like Dex, CpdA causes nuclear translocation of the GR, albeit to a lesser degree. Several lines of evidence, including fluorescence resonance energy transfer, co-immunoprecipitation, and nuclear immunofluorescence studies of nuclear localization-deficient GR show that CpdA, unlike Dex, does not elicit ligand-induced GR dimerization. Comparison of the behavior of CpdA in the presence of wild type GR to that of Dex with a dimerization-deficient GR mutant (GR(dim)) strongly supports the conclusion that loss of dimerization is responsible for the dissociated behavior of CpdA.


Figures

FIGURE 1.
FIGURE 1.
Transrepression of promoter reporter constructs of three genes involved in the in vivo response to CpdA administration in rats. A, rat CBG. BWTG3 cells (5 × 10⁴ cells/well in 24-well tissue culture plates) were transiently transfected with 360 ng of rat Cbg promoter reporter construct (ratCBG295Luc), 200 ng of pGL2-basic, and 40 ng of β-galactosidase reporter plasmid (pPGKβGeopbA). B, rat Pomc. AtT-20 cells (2.5 × 10⁵ cells/well in 24-well tissue culture plates) were transiently transfected with 240 ng of rat POMC promoter reporter construct (JA300), 60 ng of rat GR expression vector (pSVGR1), and 60 ng of rat expression vector for Nur77 (CMX-Nur77). C, mouse Gnrh. GT1-7 cells (1.25 × 10⁵ cells/well in 24-well tissue culture plates) were transiently transfected with 600 ng of mouse GnRH promoter reporter construct (3446mGnRHluc). Twenty-four (A and B) or 4 (C) h after transfection test compounds were added at a concentration of 1 μm. Control wells received an equal amount of ethanol. Cells were treated for 24 (A and B) or 20 (C) h, respectively. Luciferase values were normalized for β-galactosidase (A) or protein (B and C) values and plotted as a percentage of the average control ± S.E. (error bars). Statistical analysis was done to compare values in the presence of test compounds relative to the corresponding control using one-way analysis of variance followed by Dunnett's multiple comparisons post test (*, p < 0.05; **, p < 0.01).
FIGURE 2.
FIGURE 2.
Transrepression of the rat Cbg proximal promoter reporter construct and endogenous gene in liver cell lines. A, dose-response curves of transrepression of the rat CBG295Luc promoter reporter construct by CpdA and Dex in the presence of endogenous GR. The rat CBG295Luc promoter reporter construct (360 ng) plus 200 ng of pGL2-basic and 40 ng of pPGKβGeopbA were transiently transfected into BWTG3 cells (5 × 10⁴ cells/well in 24-well tissue culture plates). Twenty-four h after transfection cells were treated with increasing concentrations of test compounds, as indicated, and lysed after 24 h. Control wells received an equal amount of ethanol. Luciferase values were normalized for β-galactosidase and plotted as a percentage of the average control ± S.E. (error bars). Log EC50 and percentage repression values were determined by fitting a sigmoidal dose-response curve with the variable slope. B, transrepression of human CBG mRNA. HepG2 cells were treated with Dex (1 μm) or CpdA (10 μm) for 72 h. Control wells received an equal amount of ethanol. Total RNA was analyzed with Northern blot analysis, using hCBG cDNA, stripped, and reprobed with β-actin to control for loading. CBG results are presented as normalized relative to β-actin and as % of average control ± S.E. (error bars). Statistical analysis was done to compare values in the presence of test compounds relative to the corresponding control using one-way analysis of variance followed by Dunnett's multiple comparisons post test (*, p < 0.05; ***, p < 0.001). C, transrepression of the rat CBG295Luc promoter reporter construct by CpdA and Dex in the absence or presence of co-transfected rGRα and RU486. BWTG3 cells (5 × 10⁴ cells/well in 24-well tissue culture plates) were transiently transfected with rat CBG295Luc (360 ng), 200 ng of rGRα (pSVGR1) or pGL2-basic as indicated, and 40 ng of pPGKβGeopbA. Twenty-four h after transfection, test compounds were added (CpdA at 10 μm; Dex at 1 μm; RU486 at 20 μm) and cells were lysed after 24 h. Control wells received an equal amount of ethanol. Luciferase values were normalized for β-galactosidase and plotted as a percentage of the average control ± S.E. (error bars). Statistical analysis was done to (i) compare values in the presence of test compounds relative to the corresponding control using one-way analysis of variance followed by Dunnett's multiple comparison's post test (*, p < 0.05; **, p < 0.01), and to (ii) compare values without GR (−rGRα) to values with co-transfected GR (+rGRα) and RU486 (+RU486) for each compound tested using one-way analysis of variance followed by Dunnett's multiple comparisons post test (a, p < 0.05; b, p < 0.01; c, p < 0.001).
FIGURE 3.
FIGURE 3.
Transactivation of a GRE-containing promoter reporter construct and endogenous gene in a liver cell line. A, transactivation of a GRE-containing promoter by CpdA and Dex in BWTG3 cells, in the absence or presence of co-transfected rGRα. BWTG3 cells (5 × 10⁴ cells/well in 24-well tissue culture plates) were transiently transfected with 360 ng of GRE-driven promoter reporter construct ((GRE)2tkLuc), 200 ng of rGRα (pSVGR1) or pGL2-basic as indicated, and 40 ng of pPGKβGeopbA. Twenty-four h after transfection, test compounds were added (CpdA at 10 μm; Dex at 1 μm) and cells were lysed after 24 h. Control wells received an equal amount of ethanol. Luciferase values were normalized for β-galactosidase and values plotted as a percentage of the average control ± S.E. (error bars). Statistical analysis was done to (i) compare values in the presence of test compounds relative to the corresponding control using one-way analysis of variance followed by Dunnett's multiple comparison's post test (*, p < 0.05; **, p < 0.01) and to (ii) compare values without GR (−rGRα) to values with co-transfected GR (+rGRα) for each compound tested using a two-tailed unpaired t test (a, p < 0.05; b, p < 0.01). B, transactivation of GRE-containing promoter by CpdA and Dex in BWTG3 cells, in the absence or presence of RU486. The (GRE)2tkLuc promoter reporter construct (360 ng) was transiently transfected into BWTG3 cells (5 × 10⁴ cells/well in 24-well tissue culture plates), together with 200 ng of rGRα (pSVGR1) and 40 ng of pPGKβGeopbA. Cells were treated with 10 μm test compounds as indicated. Control wells received an equal amount of ethanol. Luciferase values were normalized for β-galactosidase and plotted as a percentage of the average ± S.E. transactivation by Dex alone. Statistical analysis was done to compare values in the presence of test compounds relative to the corresponding controls using one-way analysis of variance followed by Dunnett's multiple comparison's post test (*, p < 0.05; **, p < 0.01; ***, p < 0.001). C, transactivation of TAT mRNA. BWTG3 cells were treated with Dex (1 μm) or CpdA (10 μm) for 72 h. Control wells received an equal amount of ethanol. Total RNA was reverse transcribed and the cDNA obtained subjected to PCR analysis with primers to detect mTAT and glyceraldehyde-3-phosphate dehydrogenase (GAPDH) (housekeeping gene used as an internal control) in separate reactions. PCR products were separated on agarose gel and visualized under UV light after EtBr staining. The figure is representative of three independent experiments. D, transactivation of TAT activity. BWTG3 cells were treated with Dex (1 μm) or CpdA (10 μm) for 4 h. Control wells received an equal amount of ethanol. Cell lysate was prepared and assayed for TAT activity ± S.E. (error bars). Statistical analysis was done to compare values in the presence of test compounds relative to control using one-way analysis of variance followed by Dunnett's multiple comparisons post test (*, p < 0.05).
FIGURE 4.
FIGURE 4.
Binding of CpdA to rodent GR and translocation to nucleus. A, competitive whole cell binding in BWTG3 cells of 20 nm [3H]Dex in the presence of increasing concentrations of unlabeled Dex or CpdA. The results shown are from two independent experiments performed in quadruplicate. Points indicate average ± S.E. Curve fitting was performed using non-linear regression and one-site competition to obtain log EC50 and maximal displacement. Ki values were obtained using the method of Cheng and Prusoff (68). B, kinetics of binding in BWTG3 cells of 1 nm [3H]Dex in the absence (0 μm CpdA) and presence of CpdA (1 and 10 μm). The results shown are from three independent experiments performed in triplicate ± S.E. (error bars). To obtain t½ curve fitting was performed using non-linear regression and one phase exponential association and one phase exponential decay, respectively. C, nuclear translocation of transiently transfected rGR in COS-1 cells. pTC2-wtGRrat (11.6 μg) was transiently transfected into COS-1 cells (2 × 10⁶ cells/plate in 10-cm tissue culture dishes) and replated 24 h later (3 × 10⁵ cells/well in a 6-well plate) into DMEM supplemented with 10% stripped FCS for 24 h before being treated with Dex (1 μm) or CpdA (10 μm) for 0, 2, 4, 6, 10, 15, 20, 40, or 60 min. After fixation, cells were subjected to immunostaining with rabbit anti-GR, followed by anti-rabbit Alexa 488 as a secondary antibody. Hoechst 33258 stain was used to visualize nuclei. Cells were analyzed using an IX 81 Olympus microscope. The percentage of cells showing nuclear localization of GR was quantified for three independent experiments ± S.E. (error bars). One-phase exponential association curve fitting was conducted to determine t½ and maximal localization.
FIGURE 5.
FIGURE 5.
Dex, but not CpdA, results in ligand-induced dimerization of the GR in COS-1 cells. A, co-immunoprecipitation of differentially tagged GR. COS-1 cells were transiently transfected with FLAG-tagged GR (pEFFlaghGRα, mass 96 kDa), GFP-tagged GR (pEGFP-C2-GR, mass 128.5 kDa), and pGL2-basic and treated with ethanol (control), 10−6 m Dex or 10−5 m CpdA for 1 h. Cellular extracts were immunoprecipitated with anti-FLAG beads. Western blots were probed with anti-GR antibody. The figure is representative of three independent experiments. B, FRET analysis of GR dimerization. COS-1 cells were transiently transfected with CFP-tagged GR (pECFP-hGRα) and YFP-tagged GR (pEYFP-hGRα) and treated with ethanol (control), 10−5 m Dex or CpdA for 30 min while FRET intensity was monitored on the Olympus IX 81 motorized inverted microscope at 37 °C. Corrected FRET is plotted against time. The figure is representative of three independent experiments. C, Dex, but not CpdA, induces nuclear localization of the GR mutant when co-transfected with wtGR in COS-1 cells. COS-1 cells (3 × 10⁶ per plate in 10-cm tissue culture dishes) were transfected (I) with 12 μg of WT rat GRα (pSVGR1) alone (wtGR), (II) with 12 μg of c-myc-tagged nuclear translocation mutant GR alone (myGRNL1), or (III) with 12 μg DNA in an 8:1 ratio of wtGR:myGRNL1(wtGR:myGRNL1) and replated 24 h later (5 × 10⁵ cells/well in a 6-well plate) into Opti-MEM for 24 h before induction with Dex (1 or 10 μm) or CpdA (1 or 10 μm) for 60 min. Control wells received an equal amount of ethanol. Localization of constructs was visualized as follows: (I) wtGR alone by indirect immunofluorescence using a rabbit anti-GR antibody followed by an Alexa Fluor 594-tagged anti-rabbit antibody (anti-GR; red); (II and III) myGRNL1 alone or wtGR:myGRNL1 by indirect immunofluorescence using a mouse anti-c-myc antibody followed by an Alexa Fluor 488-tagged anti-mouse antibody (anti-myc; green). Nuclei were visualized with 4′,6-diamidino-2-phenylindole staining (blue). Cells were analyzed using a Zeiss confocal LSM410 microscope. The percentage of cells showing nuclear (closed bars), both (hatched bars), or cytoplasmic (open bars) localization of GR was quantified for three independent experiments and is presented graphically ± S.E. (error bars). Representative micrographs for control, Dex (10 μm), and CpdA (10 μm) are presented to the right of each graph.
FIGURE 6.
FIGURE 6.
Implications of loss of GR dimerization induced by CpdA. A, nuclear import of transiently transfected mouse GR and mouse GRdim mutant in COS-1 cells. COS-1 cells (2 × 10⁶ cells/plate in 10-cm tissue culture dishes) were transiently transfected with 7.5 μg of pcDNA3.1-GRWT or pcDNA3.1-GRdim and replated 24 h later (3 × 10⁵ cells/well in a 6-well plate) in DMEM supplemented with 10% stripped FCS. After 24 h cells were treated with Dex (1 μm) or CpdA (10 μm) for 0, 2, 4, 6, 10, 20, 30, 45, or 60 min. After fixation, cells were subjected to immunostaining with anti-GR, followed by anti-rabbit Alexa 488 as a secondary antibody. Hoechst 33258 stain was used to visualize nuclei. Cells were analyzed using an IX 81 Olympus microscope. The percentage of cells showing nuclear localization of GR was quantified for three independent experiments ± S.E. (error bars). One-phase exponential association curve fitting was conducted to determine t½ and maximal localization. B, nuclear export of transiently transfected mouse GR and mouse GRdim mutant in COS-1 cells. COS-1 cells (2 × 10⁶ cells/plate in 10-cm tissue culture dishes) were transiently transfected with 7.5 μg of pcDNA3.1-GRWT or pcDNA3.1-GRdim and replated 24 h later (3 × 10⁵ cells/well in a 6-well plate) in DMEM supplemented with 10% stripped FCS for 24 h before being treated with Dex (1 μm) or CpdA (10 μm) for 45 min, washed, and monitored over 0, 4, 8, 12, 20, 24, and 28 h. After fixation, cells were subjected to immunostaining with rabbit anti-GR, followed by anti-rabbit Alexa 488 as a secondary antibody. Hoechst 33258 stain was used to visualize nuclei. Cells were analyzed using an IX 81 Olympus microscope. The percentage of cells showing nuclear localization of GR was quantified for three independent experiments ± S.E. (error bars). One phase exponential decay curve fitting was conducted to determine t½. C, transactivation of the transiently transfected GRE-containing promoter reporter construct via mouse GR or mouse GRdim mutant. COS-1 cells (1 × 10⁴ cells/well in 96-well tissue culture plates) were transiently transfected with 100 ng of pTAT-GRE2-Elb-luc, 10 ng of pcDNA3.1-GRWT or pcDNA3.1-GRdim as indicated, and 10 ng of pPGKβGeopbA. Twenty-four h after transfection cells were induced with Dex (1 μm) or CpdA (10 μm) for 24 h. Control wells received an equal amount of ethanol. Luciferase values were normalized for β-galactosidase and values plotted as fold-induction relative to average control ± S.E. (error bars). D, transrepression of the transiently transfected rat CBG295Luc promoter reporter construct via mouse GR or mouse GRdim mutant. COS-1 cells (2 × 10⁶ cells/plate in 10-cm tissue culture dishes) were transiently transfected with 9 μg of CBG295Luc and 3 ng of pcDNA3.1-GRWT or pcDNA3.1-GRdim as indicated. Twenty-four h after transfection cells were replated (5 × 10⁴ cells/well in 24-well tissue culture plates). Cells were induced for 24 h with Dex (1 μm) or CpdA (10 μm) 24 h after replating. Control wells received an equal amount of ethanol. Luciferase values were normalized with protein concentration and values plotted as fold-induction relative to average control ± S.E. (error bars). E, transrepression of the transiently transfected IL6-luc promoter reporter construct via mouse GR or mouse GRdim mutant. COS-1 cells (2 × 10⁶ cells/plate in 10-cm tissue culture dishes) were transiently transfected with 9 μg of p(IL6κB)350hu.IL6Pluc+ and 0.9 μg of pcDNA3.1-GRWT or pcDNA3.1-GRdim as indicated. Twenty-four h after transfection cells were replated (5 × 10⁴ cells/well in 24-well tissue culture plates). Cells were induced for 24 h with PMA (10 ng/ml) alone or with Dex (1 μm) or CpdA (10 μm) 24 h after replating. Control wells received an equal amount of ethanol. Luciferase values were normalized with protein concentration and values plotted as percentage induction with PMA induction alone as 100% ± S.E. (error bars). Statistical analysis was done to compare values in the presence of test compounds relative to the corresponding control (C and D) or PMA induction alone (E) using one-way analysis of variance followed by Dunnett's multiple comparisons post test (*, p < 0.05; **, p < 0.01; ***, p < 0,001).
FIGURE 7.
FIGURE 7.
Steroid receptor specificity of CpdA. A, transactivation of transiently transfected GRE-containing promoter reporter construct via GR, MR, PR, or AR, or ERE-containing promoter reporter construct via ER. COS-1 cells (1 × 10⁵ cells/well in 24-well tissue culture plates) were transiently transfected with 300 ng of pTAT-GRE2-Elb-luc, 30 ng of pPGKβGeopbA, and 30 ng of pRS-hGRα, pRS-hMR, pSG5hPRB, or pSVARo as indicated, or 1200 ng of pGL2–3x-ERE-TATA-luc, 30 ng of pPGKβGeopbA, and 30 ng of pcDNA3-ERα. Twenty-four h after transfection cells were induced for 24 h with solvent (ethanol), agonist (10−6 m), or CpdA (10−5 m) (agonist mode), or with agonist (10−6 m), agonist (10−6 m) plus antagonist (10−6 m), or agonist (10−6 m) plus CpdA (10−5 m) (antagonist mode). Luciferase values were normalized with β-galactosidase and values plotted as fold-induction ± S.E. (error bars) relative to average solvent. Statistical analysis was done to compare values in the presence of test compounds relative to solvent (*, p < 0.05; **, p < 0.01; ***, p < 0.00) for agonist mode or corresponding agonist ($, p < 0.05; $$, p < 0.01; $$$, p < 0.001) for antagonist mode using one-way analysis of variance with Dunnett's multiple comparisons test as post test. B, transrepression of transiently transfected IL-6 promoter reporter construct via GR, MR, PR, AR, or ER. COS-1 cells (2 × 10⁶ cells/plate in 10-cm tissue culture dishes) were transiently transfected with 9 μg of p(IL6κB)350hu.IL6Pluc+ and 0.9 μg of pRS-hGRα, pRS-hMR, pSG5hPRB, pSVARo, or pcDNA3-ERα as indicated. Twenty-four h after transfection cells were replated (5 × 10⁴ cells/well in 24-well tissue culture plates). Cells were induced for 24 h with solvent (ethanol), PMA (10 ng/ml), PMA plus agonist (10−6 m), or PMA plus CpdA (10−5 m) (agonist mode) or with PMA, PMA plus agonist (10−6 m), PMA plus agonist (10−6 m) and antagonist (10−6 m), or PMA plus agonist (10−6 m) and CpdA (10−5 m) (antagonist mode) 24 h after replating. Luciferase values were normalized with protein concentration and values plotted as fold-induction ± S.E. (error bars) relative to average solvent (agonist mode) or as percentage of PMA induction (antagonist mode). Statistical analysis was done to compare values in the presence of test compounds relative to PMA induction (*, p < 0.05; **, p < 0.01; ***, p < 0.00) for agonist mode or PMA plus corresponding agonist induction ($, p < 0.05; $$, p < 0.01; $$$, p < 0.001) for antagonist mode using one-way analysis of variance with Dunnett's multiple comparisons test as post test. Agonists used: Dex for GR; aldosterone for MR; R5020 for PR; DHT for AR; E2 for ER. Antagonists used: RU486 for GR; spironolactone for MR; RU486 for PR; hydroxyflutamide for AR; ICI 182,780 for ER.
FIGURE 8.
FIGURE 8.
CpdA shows greater steroid receptor specificity in context of the Cbg promoter construct and at the CBG, but not TAT, protein level. A, steroid receptor specificity of transrepression of the transiently transfected rat CBG295Luc promoter reporter construct via GR, MR, PR, AR, or ER. COS-1 cells (2 × 10⁶ cells/plate in 10-cm tissue culture dishes) were transiently transfected with 9 μg of CBG295Luc and 3 ng of pRS-hGRα, pRS-hMR, pSG5hPRB, pSVARo, or pcDNA3-ERα as indicated. Twenty-four h after transfection cells were replated (5 × 10⁴ cells/well in 24-well tissue culture plates) in medium with 10% dextran-coated charcoal-stripped FCS and 1% antibiotics, except for assays investigating ER activity, where phenol red-free medium with 10% dextran-coated charcoal-stripped FCS and 1% antibiotics was used. Cells were induced, in DMEM without supplements except in assays investigating ER activity, where phenol red-free medium with 10% dextran-coated charcoal-stripped FCS and 1% antibiotics was used, for 24 h with solvent (ethanol), agonist (10−6 m), or CpdA (10−5 m) 24 h after replating. Luciferase values were normalized with protein concentration and values plotted as fold-induction ± S.E. (error bars) relative to average control. Statistical analysis was done for each steroid receptor to compare values in the presence of test compounds relative to the corresponding control using two-way analysis of variance followed by Bonferroni post tests (*, p < 0.05; **, p < 0.01; ***, p < 0.001). B, transrepression of CBG protein levels by steroid receptor ligands via endogenous steroid receptors in BWTG3 cells. BWTG3 cells (2.5 × 10⁵ cells/well in 6-well tissue culture plates) were induced 24 h after plating with solvent (ethanol), steroid receptor agonist (10−6 m) or CpdA (10−5 m) in medium with 10% dextran-coated charcoal-stripped FCS and antibiotics except for assays investigating ER activity, where phenol red-free medium with 10% dextran-coated charcoal-stripped FCS and antibiotics was used. After 24 h cells were lysed, and lysates were separated on a SDS-PAGE gel and transferred to a Hybond-ECL nitrocellulose membrane, which was probed for CBG (S1000–76Z) and actin (sc-1616). Proteins were visualized using ECL peroxidase-labeled anti-goat antibody and ECL Western blotting detection reagents on Hyperfilm. For determination of CBG levels Hyperfilm bands of CBG and actin were quantified and results expressed as intensity of the CBG band relative to actin band ± S.E. (error bars). Statistical analysis was done to compare values in the presence of test compounds relative to the corresponding control using one-way analysis of variance followed by Dunnett's multiple comparisons post test (*, p < 0.05; **, p < 0.01; ***, p < 0,001). Table inset: whole cell binding was done in BWTG3 cells to determine endogenous steroid receptor levels by incubating BWTG3 cells with [3H]Dex for GR, [3H]E2 for ER, [3H]R5020 for PR, [3H]mibolerone for AR, or [3H]aldosterone for MR. Cognate unlabeled ligands were added in 1000-fold excess. Specific binding is presented in femtomole/mg of protein. C, transactivation of TAT activity in BWTG3 cells transfected with AR. BWTG3 cells (2.5 × 10⁵ cells/well in 6-well tissue culture plates) were transiently transfected with 150 ng of pSVARo and induced 24 h after transfection with solvent (ethanol), DHT, AR agonist (10−6 m), DHT, AR agonist (10−6 m) plus hydroxyflutamide, AR antagonist (10−6 m), or DHT, AR agonist (10−6 m) plus CpdA (10−5 m) in medium with 10% dextran-coated charcoal-stripped FCS and antibiotics. Cell lysate was prepared and assayed for TAT activity ± S.E. (error bars) 4 h after induction. Statistical analysis was done to compare values in the presence of test compounds relative to control using one-way analysis of variance followed by Dunnett's multiple comparisons post test (*, p < 0.05). Agonists used: Dex for GR; aldosterone (Ald) for MR; R5020 for PR; DHT for AR; E2 for ER. Antagonists used: hydroxyflutamide for AR.

Similar articles

Cited by

References

    1. Swart P., Swart A. C., Louw A., van der Merwe K. J. (2003) Bioessays 25, 612–619 - PubMed
    1. Louw A., Swart P., de Kock S. S., van der Merwe K. J. (1997) Biochem. Pharmacol. 53, 189–197 - PubMed
    1. Louw A., Allie F., Swart A. C., Swart P. (2000) Endocr. Res. 26, 729–736 - PubMed
    1. Louw A., Swart P., Allie F. (2000) Biochem. Pharmacol. 59, 167–175 - PubMed
    1. Louw A., Swart P. (1999) Endocrinology 140, 2044–2053 - PubMed

Publication types

MeSH terms