. 2010 Feb;13(2):190-6.
doi: 10.1038/nn.2476. Epub 2009 Dec 27.

Amyloid beta from axons and dendrites reduces local spine number and plasticity

Affiliations

Amyloid beta from axons and dendrites reduces local spine number and plasticity

Wei Wei et al. Nat Neurosci. 2010 Feb.

Abstract

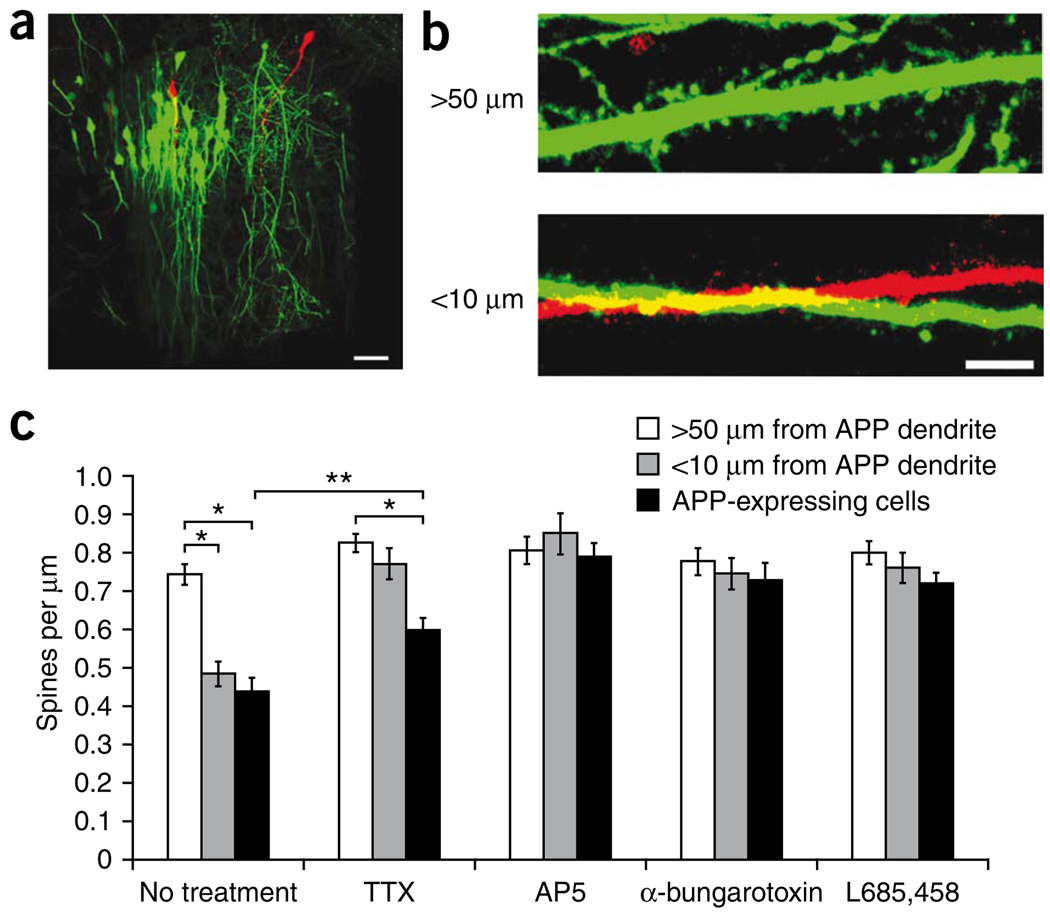
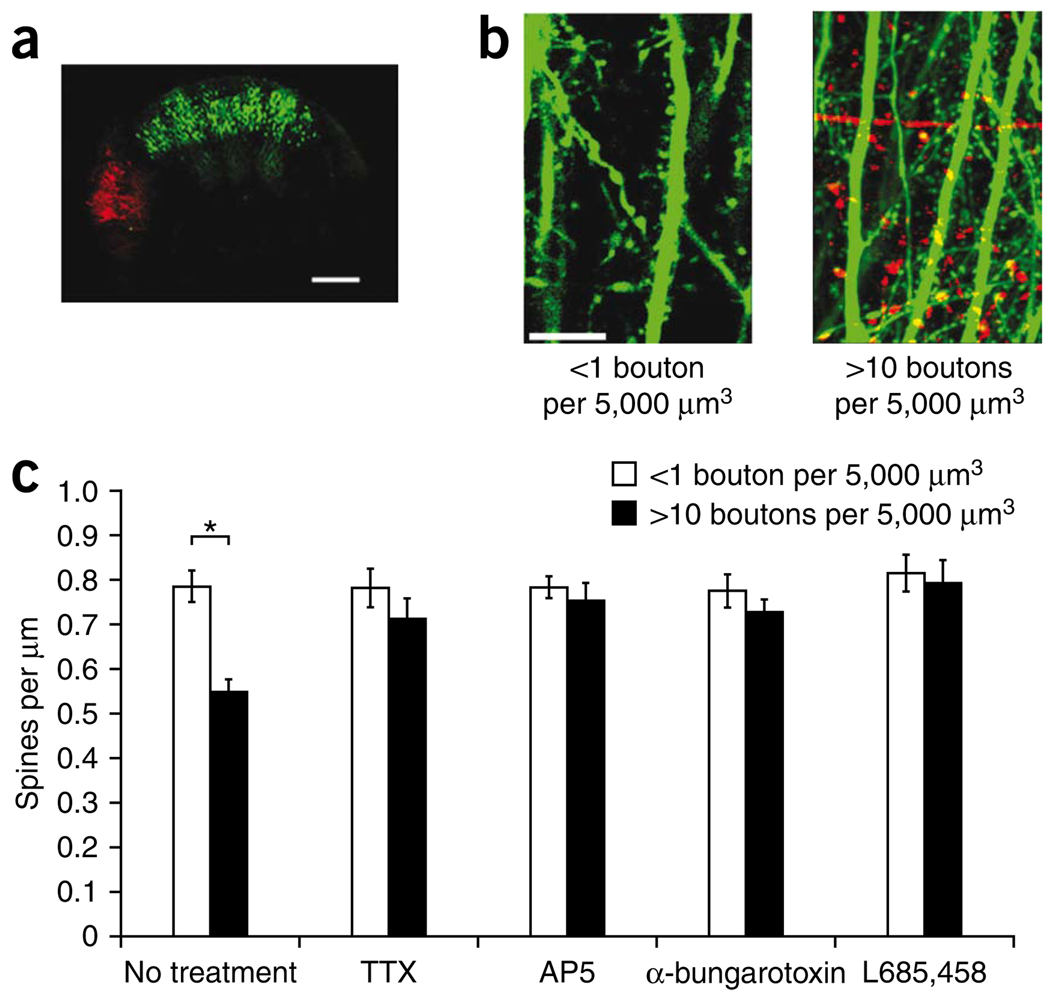
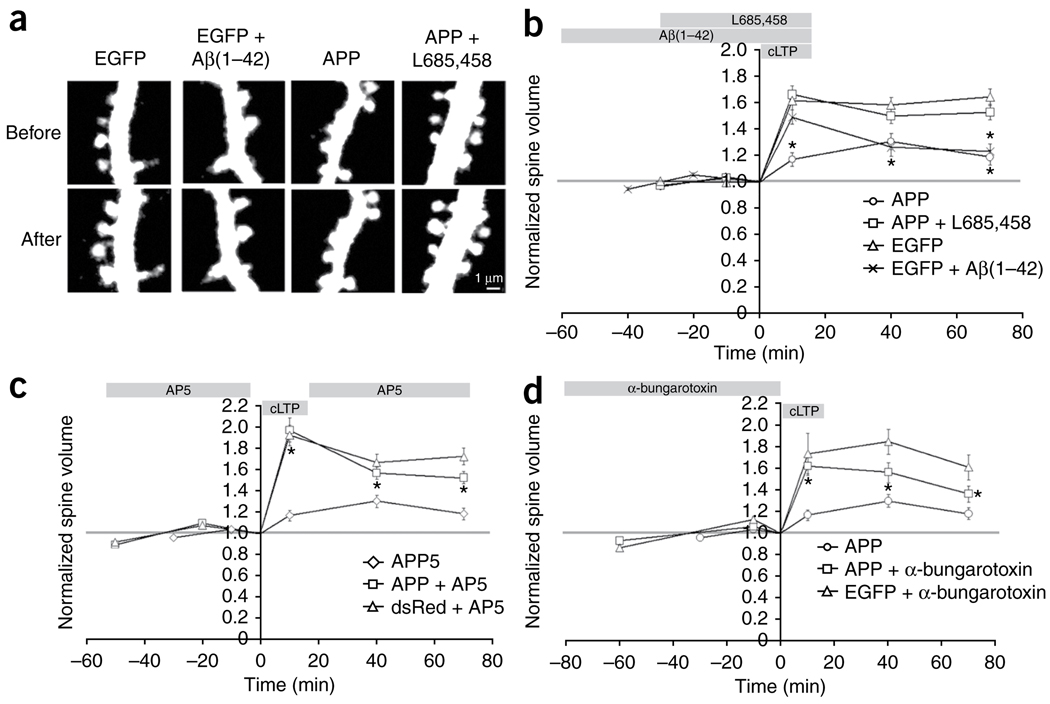
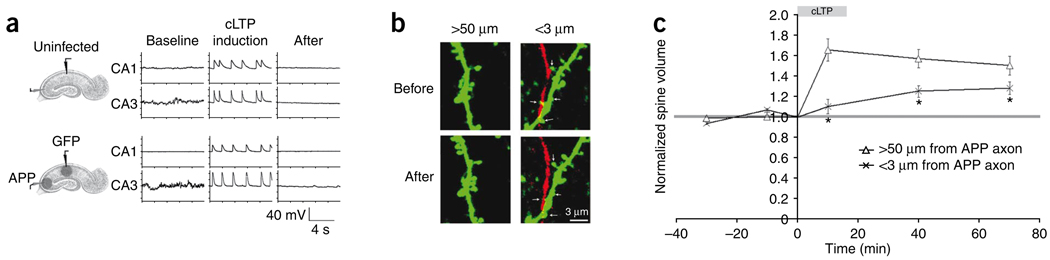
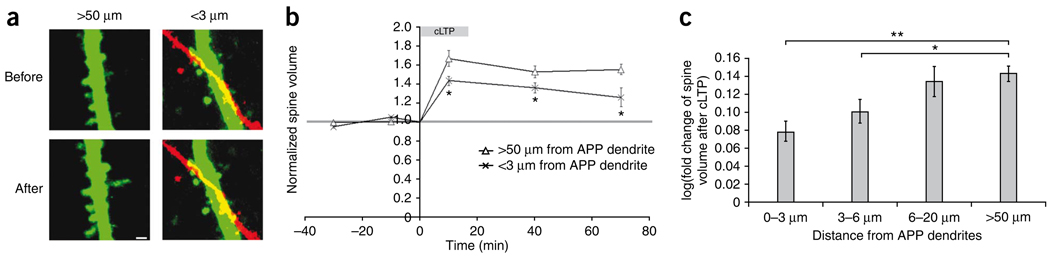
Excessive synaptic loss is thought to be one of the earliest events in Alzheimer's disease. Amyloid beta (Abeta), a peptide secreted in an activity-modulated manner by neurons, has been implicated in the pathogenesis of Alzheimer's disease by removing dendritic spines, sites of excitatory synaptic transmission. However, issues regarding the subcellular source of Abeta, as well as the mechanisms of its production and actions that lead to synaptic loss, remain poorly understood. In rat organotypic slices, we found that acute overproduction of either axonal or dendritic Abeta reduced spine density and plasticity at nearby ( approximately 5-10 mum) dendrites. The production of Abeta and its effects on spines were sensitive to blockade of action potentials or nicotinic receptors; the effects of Abeta (but not its production) were sensitive to NMDA receptor blockade. Notably, only 30-60 min blockade of Abeta overproduction permitted induction of plasticity. Our results indicate that continuous overproduction of Abeta at dendrites or axons acts locally to reduce the number and plasticity of synapses.


Figures

Figure 1
Figure 1
Dendritic Aβ reduces local spine density in an activity-dependent manner. (a) Viral-infected CA1 region of a hippocampal slice culture showing many EGFP-expressing and a few APP/tomato-expressing neurons. Scale bar represents 50 µm. (b) Apical dendrites of CA1 pyramidal neurons expressing EGFP or APP/tomato as in a. Top, an EGFP-labeled dendritic segment >50 µm away from APP-labeled structures. Bottom, an EGFP-labeled dendritic segment that is within 10 µm of an APP-labeled dendrite. Scale bar represents 5 µm. (c) Bar graph of spine density in EGFP neurons near or far from APP dendrites, and APP-expressing neurons in normal medium or medium containing TTX, AP5, α-bungarotoxin or L685,458 (no treatment (14 slices): 21, 14 and 17 dendrites for >50 µm from APP dendrite, <10 µm from APP dendrites and APP-expressing cells, respectively; TTX (13 slices): 18, 14 and 25; AP5 (10 slices): 15, 13 and 18; α-bungarotoxin (15 slices): 13, 15 and 19; L685,458 (13 slices): 19, 13 and 11). Error bars represent s.e.m. Two-way ANOVA showed significant drug × APP interaction (F = 4.38, P < 0.001; t test, * P < 0.0001, ** P = 0.002).
Figure 2
Figure 2
Axonal Aβ reduces local spine density in an activity-dependent manner. (a) Tiled two-photon laser-scanning microscopy images of a hippocampal slice culture infected with EGFP virus in the CA1 region and APP/tomato virus in the CA3 region. Scale bar represents 300 µm. (b) Images from CA1 stratum radiatum region showing a control region containing EGFP-labeled apical dendrites and <1 APP bouton per 5,000 µm3 (left) or a region containing EGFP-labeled apical dendrites and >10 APP boutons per 5,000 µm3 (right). Scale bar represents 10 µm. (c) Bar graph of spine density of EGFP neurons in regions containing <1 APP bouton per 5,000 µm3 and in regions containing >10 APP boutons per 5,000 µm3. Slices were maintained in normal medium or in medium containing TTX, AP5, α-bungarotoxin or L685,458, as indicated (no treatment (21 slices): 21 and 20 dendrites for <1 APP bouton per 5,000 µm3 and >10 APP boutons per 5,000 µm3; TTX (10 slices): 20 and 15; AP5 (12 slices): 24 and 17; α-bungarotoxin (10 slices): 20 and 39; L685,458 (10 slices): 15 and 11). Two-way ANOVA showed significant drug × APP interaction (F = 2.77, P = 0.005; t test, *P < 0.0001). Similar effects, although less robust, were seen after 1 d of APP overexpression (data not shown). Error bars represent s.e.m.
Figure 3
Figure 3
Aβ secretion is sensitive to blockade of action potentials or nAChRs, but not to blockade of NMDA receptors. (a) The CA1 region of hippocampal slice cultures was infected with APP and incubated in normal media (control) or in media containing AP5, TTX, α-bungarotoxin or L685,458. Secreted Aβ (1–42) levels were normalized to that of the control group (control, 8 membranes; AP5, 8 membranes; TTX, 4 membranes; α-bungarotoxin, 5 membranes; L685,458, 5 membranes; ANOVA, F = 4.2, P = 0.009; t test, * P < 0.002). (b) Secreted Aβ (1–40) levels were analyzed as in a (control, 8 membranes; AP5, 9 membranes; TTX, 5 membranes; α-bungarotoxin, 5 membranes; L685,458, 5 membranes; ANOVA, F = 7.54, P = 0.0004; t test between control and drug-treated groups, * P < 0.01). Error bars represent s.e.m.
Figure 4
Figure 4
Synthetic Aβ-induced spine loss can be rescued by blockade of NMDA receptors, but not by blockade of action potentials or nAChRs. The CA1 region of hippocampal slice cultures was infected with EGFP virus and incubated in normal medium or in medium containing Aβ (1–42) and AP5, TTX or α-bungarotoxin as indicated. Spine density was measured after 24 h of infection and drug treatment (no treatment: 17 dendrites, 9 slices; Aβ42: 24 dendrites, 10 slices; Aβ42 + AP5: 15 dendrites, 9 slices; Aβ42 + TTX: 13 dendrites, 7 slices; Aβ42 + α-bungarotoxin: 14 dendrites, 7 slices; ANOVA, F = 7.27, P < 0.0001; t test between no treatment and drug-treated groups, *P < 0.002). Error bars represent s.e.m.
Figure 5
Figure 5
Acute overproduction of Aβ reduces spine structural plasticity by NMDAR- and nAChR-dependent mechanisms. (a) Spine volumes from neurons transfected with EGFP or APP/dsRed before and after cLTP induction. Aβ (1–42) or L685,458 were applied as indicated. The signals from the cytoplasmic markers are displayed. Scale bar represents 1 µm. (b) Acute overproduction of Aβ reduced spine structural plasticity. The time of cLTP induction, Aβ (1–42) or L685,458 application is indicated at the top of the graph (APP: n = 166 spines, 5 slices; APP + L685,458: n = 312 spines, 8 slices; EGFP: n = 247 spines, 6 slices; EGFP + Aβ (1–42): n = 275 spines, 6 slices; ANOVA, F = 7.99, P < 0.0001; t test between APP and APP + L685,458 and between EGFP and EGFP + Aβ (1–42), *P < 0.0004). (c) AP5 rescued Aβ-mediated impairment of cLTP spine enlargement. Data from untreated APP-expressing neurons in b is also shown (APP + AP5: n = 254 spines, 8 slices; dsRed + AP5: n = 185 spines, 5 slices; ANOVA, F = 1.34, P < 0.0001; t test between APP and APP + AP5, *P < 0.001). (d) α-bungarotoxin rescued Aβ-mediated impairment of spine enlargement after cLTP induction. Data from untreated APP-expressing neurons in b is also shown (APP + α-bungarotoxin: n = 153 spines, 5 slices; EGFP + α-bungarotoxin: n = 119 spines, 4 slices; ANOVA, F = 7.62, P < 0.0001; t test between APP and APP + α-bungarotoxin, * P < 0.01). Error bars represent s.e.m.
Figure 6
Figure 6
Axonal secretion of Aβ reduces local spine structural plasticity. (a) Example traces of cell-attached recordings from a pair of uninfected CA1 and CA3 pyramidal neurons (top) or a pair of EGFP-infected CA1 cells and APP-infected CA3 cells (bottom) before, during and after cLTP induction. (b) Left, examples of EGFP-labeled spines more than 50 µm away from APP-labeled axons before and after cLTP. Right, EGFP-labeled spines within 3 µm of an APP-labeled axon before and after cLTP (arrows). Scale bar represents 3 µm. (c) The volume change of spines >50 µm from APP axons or <3 µm from APP axons before, during and after cLTP induction (>50 µm from APP axon: n = 139 spines, 25 slices; <3 µm from APP axon: n = 143 spines, 25 slices; ANOVA, F = 6.13, P = 0.0001; t test between >50 um from APP axon and <3 um from APP axon, *P < 0.0005). Error bars represent s.e.m.
Figure 7
Figure 7
Dendritic secretion of Aβ reduces local spine structural plasticity. (a) EGFP-labeled spines before and after cLTP induction. Left, spines more than 50 µm away from APP-labeled structures. Right, EGFP-labeled spines within 3 µm of an APP-labeled dendrite. Scale bar represents 1 µm. (b) The volume change of spines >50 µm from APP dendrites and of those <3 µm from APP dendrites before, during and after cLTP induction (>50 µm from APP dendrite: n = 194 spines, 42 slices; <3 µm from APP dendrite: n = 243 spines, 42 slices; ANOVA, F = 33.1, P < 0.0001; t test between >50 um from APP dendrite and <3 um from APP dendrite, *P < 0.01). (c) Bar graph of spine volume change after cLTP (log transformed) in groups of spines 0–3 µm, 3–6 µm, 6–20 µm or >50 µm from APP dendrites (0–3 µm: 0.079 ± 0.011, 358 spines; 3–6 µm: 0.101 ± 0.013, 235 spines; 6–20 µm: 0.134 ± 0.016, 180 spines; >50 µm: 0.143 ± 0.009, 580 spines, from 68 slices; ANOVA, F = 7.77, P < 0.0001; t test, *P = 0.008, **P < 0.001). Error bars represent s.e.m.

References

    1. Terry RD, et al. Physical basis of cognitive alterations in Alzheimer’s disease: synapse loss is the major correlate of cognitive impairment. Ann. Neurol. 1991;30:572–580. - PubMed
    1. Walsh DM, Selkoe DJ. Deciphering the molecular basis of memory failure in Alzheimer’s disease. Neuron. 2004;44:181–193. - PubMed
    1. Lacor PN, et al. Synaptic targeting by Alzheimer’s-related amyloid beta oligomers. J. Neurosci. 2004;24:10191–10200. - PMC - PubMed
    1. Hsieh H, et al. AMPAR removal underlies Abeta-induced synaptic depression and dendritic spine loss. Neuron. 2006;52:831–843. - PMC - PubMed
    1. Shankar GM, et al. Natural oligomers of the Alzheimer amyloid-beta protein induce reversible synapse loss by modulating an NMDA-type glutamate receptor-dependent signaling pathway. J. Neurosci. 2007;27:2866–2875. - PMC - PubMed

Publication types

MeSH terms