

doi: 10.1038/nmeth.1412.
Epub 2009 Dec 27.
Chronic microsensors for longitudinal, subsecond dopamine detection in behaving animals
Affiliations
- PMID: 20037591
- PMCID: PMC2849934
- DOI: 10.1038/nmeth.1412
Item in Clipboard
Chronic microsensors for longitudinal, subsecond dopamine detection in behaving animals
Nat Methods.
2010 Feb.
Abstract
Neurotransmission operates on a millisecond timescale but is changed by normal experience or neuropathology over days to months. Despite the importance of long-term neurotransmitter dynamics, no technique exists to track these changes in a subject from day to day over extended periods of time. Here we describe and characterize a microsensor that can detect the neurotransmitter dopamine with subsecond temporal resolution over months in vivo in rats and mice.
Figures
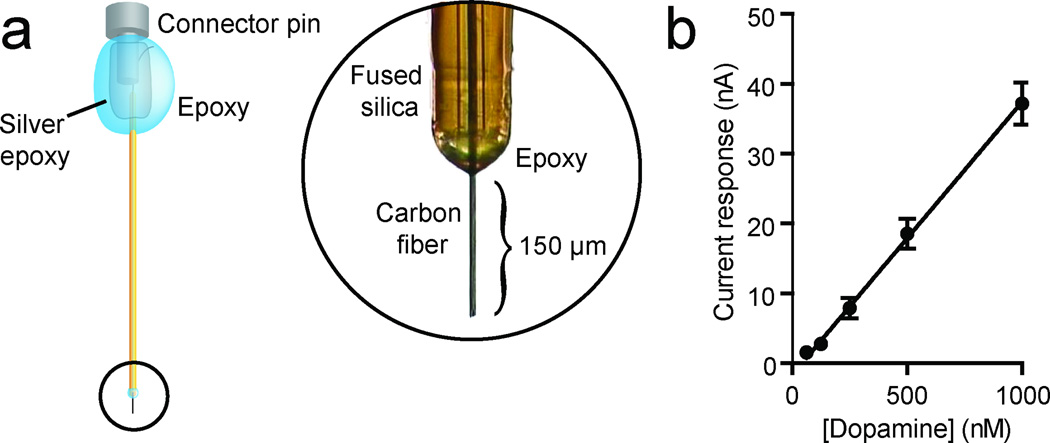
(a) All chronic microsensors used in these experiments consisted of a carbon fiber encased in a polyimide fused silica. In order to ensure electric insulation, a two-component epoxy was applied to the fused silica carbon fiber interface. At the opposite end, a female pin connector was electrically connected to the carbon fiber with silver epoxy. Finally, two-component epoxy was used to coat the connector for electrical insulation and structural integrity. (b) The response of the microsensor was found to be linear to physiological concentrations of dopamine (n = 5, r2 = 0.92, P < 0.0001). Data are mean ± s.e.m.
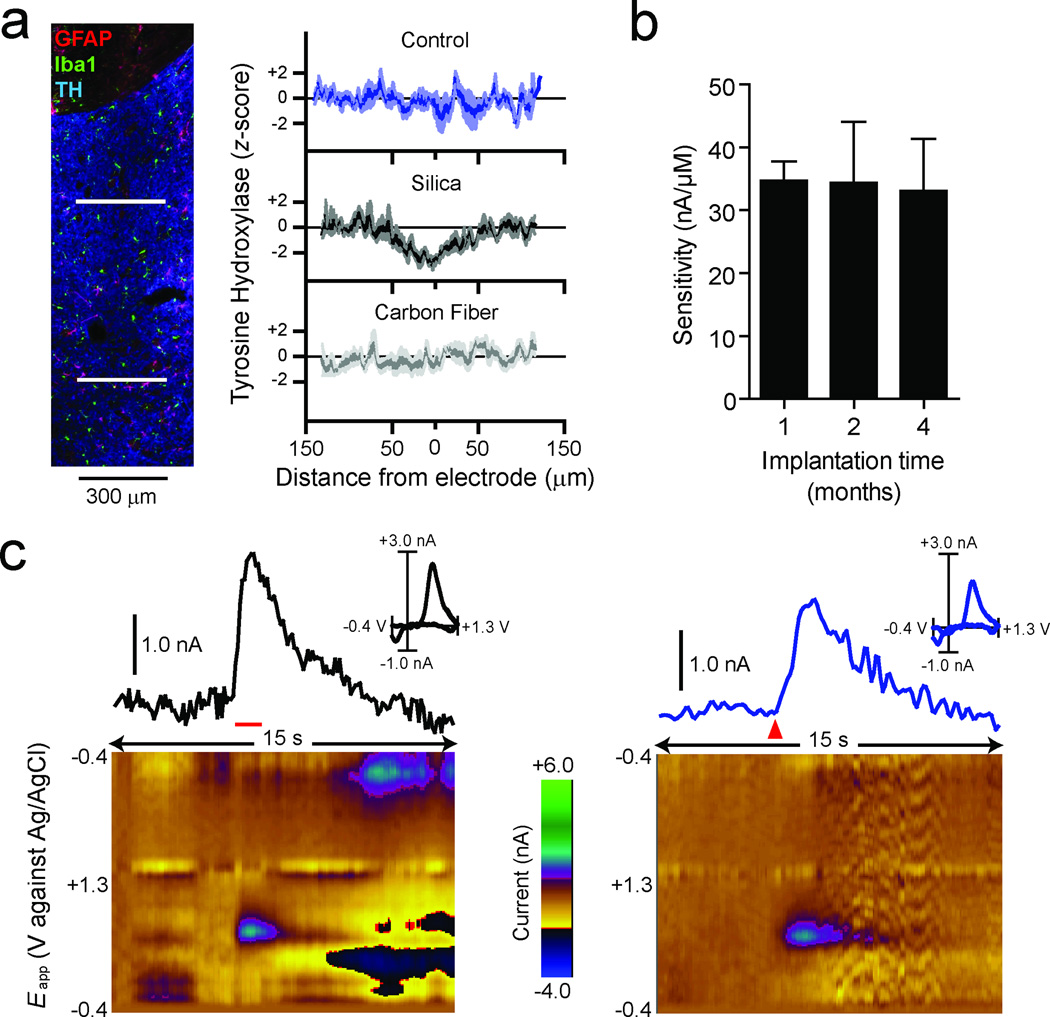
(a) 30-µm striatal slices were stained for astrocytes (GFAP, red), microglia (Iba1, green), and tyrosine hydroxylase (TH, blue). The composite image (left) shows the microsensor tract ending ventral to the anterior commissure with no apparent gliosis present. Line scans of TH intensities (right) were made across the fused-silica tract (upper white line) and the carbon-fiber tract (lower white line). Comparison of z-scores (n = 5) shows a decrease in TH intensity 100 µm in diameter at the fused-silica tract (90 µm diameter) compared to control but not at the carbon-fiber tract. (b) Comparison of microsensor sensitivity to dopamine after one (n = 5), two (n = 5), or four (n = 4) months of implantation. The sensitivity of each microsensor was assessed with flow injection analysis and was found to be unchanged over the time course assessed. Data are presented as mean ± s.e.m. (c) Voltammetric signal and corresponding background-subtracted cyclic voltammogram (inset) in response to stimulation of the ventral tegmental area (60 Hz, 24 pulses at 120 µA; left panel, red horizontal bar) or reward delivery (right panel, red triangle) in the same animal and on the same day. The pseudocolor plots depict color-coded observed changes in redox currents as a function of applied potential (y-axis) plotted over time (x-axis).
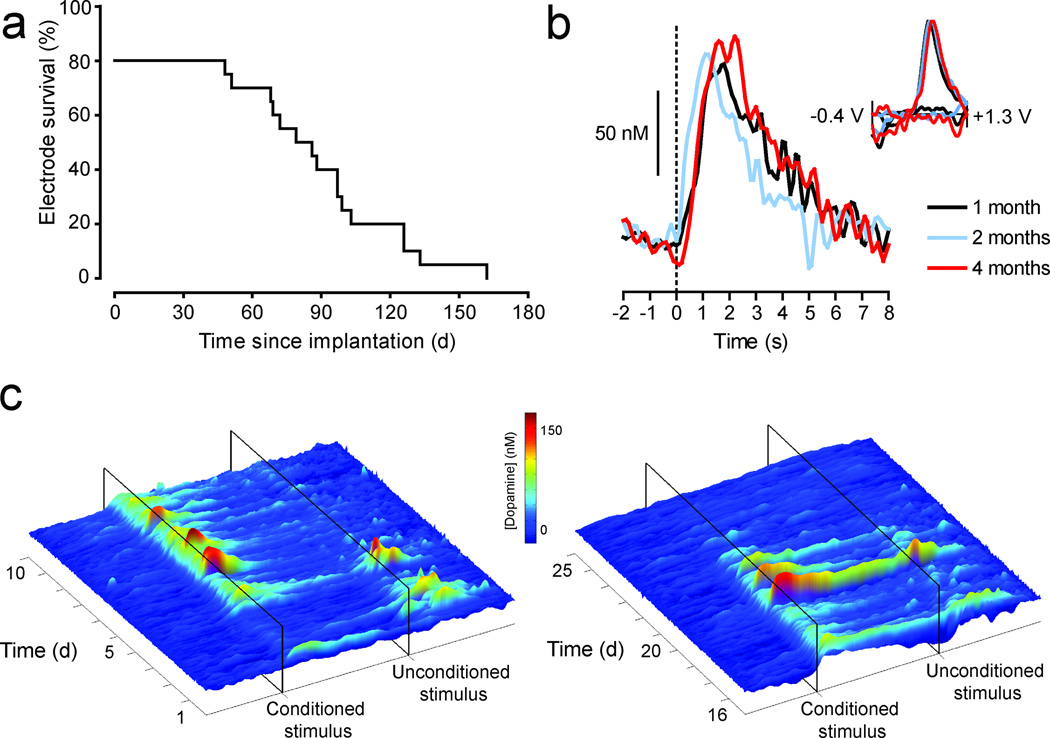
(a) A survival curve depicting the attrition rate of chronic microsensors as a function of time since implantation. A microsensor was classified as “viable” if an electrochemical signal elicited by reward delivery met criterion for dopamine where it was statistically correlated with a background-subtracted cyclic voltammogram obtained from electrically evoked dopamine (r2 ≥ 0.75). (b) Voltammetric signals in response to reward delivery at time zero, one (black), two (blue) and four (red) months post-implantation. Background-subtracted cyclic voltammograms are all consistent with the electrochemical signature for dopamine (inset). (c) Voltammetric signals in response to reward delivery (unconditioned stimulus) and a predictive cue (conditioned stimulus) during pavlovian conditioning. The surface plots show trial-by-trial fluctuations in dopamine concentration during the twenty-second period around reward and cue presentation during acquisition (days 1–10, left plot), a period when the reward value was increased from one to four food pellets (days 16–20, right plot), and extinction (days 21–25, right plot) in a representative animal. The probability of approach to the cue increased during training (0.0 on day 1 to 1.0 on day 5), remained stable through day 10 (0.92), and decreased after extinction training (0.80 on day 20 to 0.12 on day 25) as did the cue-evoked dopamine response.
Comment in
-
Advancing neurochemical monitoring.Nat Methods. 2010 Feb;7(2):106-8. doi: 10.1038/nmeth0210-106. Nat Methods. 2010. PMID: 20111035 No abstract available.
References
Publication types
MeSH terms
Substances
Grants and funding
- R21 DA024140/DA/NIDA NIH HHS/United States
- T32 AA007455/AA/NIAAA NIH HHS/United States
- T32 DA007278/DA/NIDA NIH HHS/United States
- F32 DA024540/DA/NIDA NIH HHS/United States
- R01 DA014486/DA/NIDA NIH HHS/United States
- T32-AA007455/AA/NIAAA NIH HHS/United States
- R21 DA021793/DA/NIDA NIH HHS/United States
- R01-MH079292/MH/NIMH NIH HHS/United States
- T32-DA007278/DA/NIDA NIH HHS/United States
- F32-DA024540/DA/NIDA NIH HHS/United States
- R01-DA014486/DA/NIDA NIH HHS/United States
- R01 MH079292/MH/NIMH NIH HHS/United States
- T32 GM007270/GM/NIGMS NIH HHS/United States
- T32-GM007270/GM/NIGMS NIH HHS/United States
- R21-DA024140/DA/NIDA NIH HHS/United States
LinkOut - more resources
Full Text Sources
Other Literature Sources
Medical
