. 2009 Dec 23;4(12):e8372.
doi: 10.1371/journal.pone.0008372.

Phosphorylation of S776 and 14-3-3 binding modulate ataxin-1 interaction with splicing factors

Affiliations

Phosphorylation of S776 and 14-3-3 binding modulate ataxin-1 interaction with splicing factors

Cesira de Chiara et al. PLoS One. .

Abstract

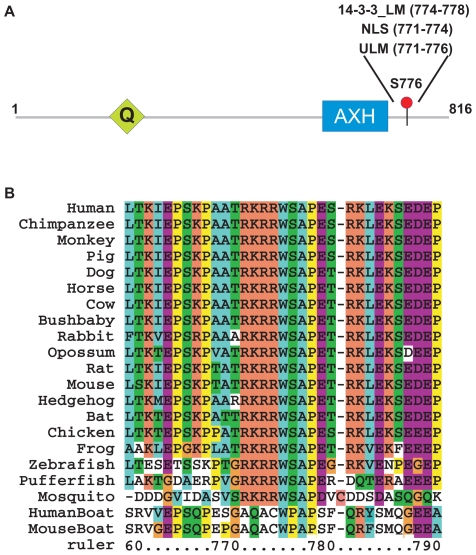
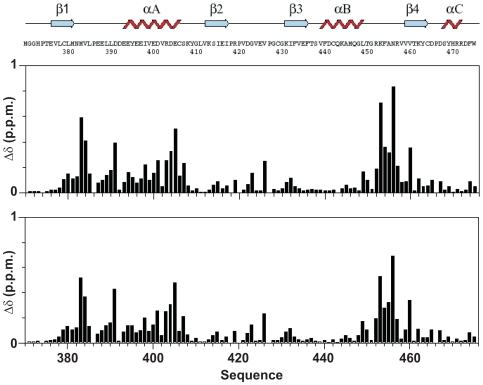
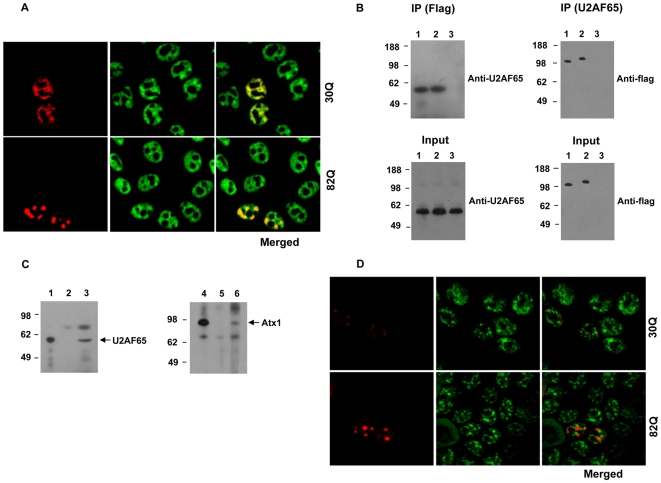
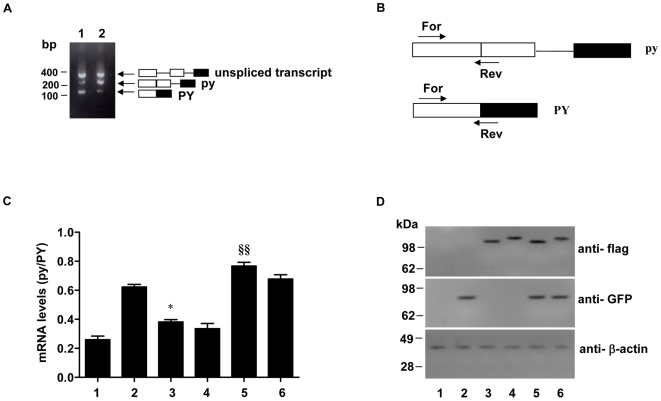
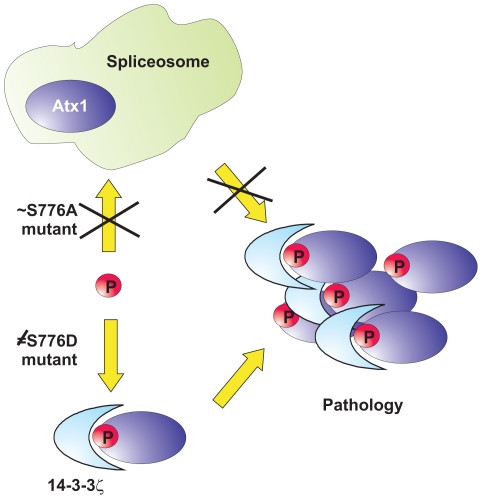
Ataxin-1 (Atx1), a member of the polyglutamine (polyQ) expanded protein family, is responsible for spinocerebellar ataxia type 1. Requirements for developing the disease are polyQ expansion, nuclear localization and phosphorylation of S776. Using a combination of bioinformatics, cell and structural biology approaches, we have identified a UHM ligand motif (ULM), present in proteins associated with splicing, in the C-terminus of Atx1 and shown that Atx1 interacts with and influences the function of the splicing factor U2AF65 via this motif. ULM comprises S776 of Atx1 and overlaps with a nuclear localization signal and a 14-3-3 binding motif. We demonstrate that phosphorylation of S776 provides the molecular switch which discriminates between 14-3-3 and components of the spliceosome. We also show that an S776D Atx1 mutant previously designed to mimic phosphorylation is unsuitable for this aim because of the different chemical properties of the two groups. Our results indicate that Atx1 is part of a complex network of interactions with splicing factors and suggest that development of the pathology is the consequence of a competition of aggregation with native interactions. Studies of the interactions formed by non-expanded Atx1 thus provide valuable hints for understanding both the function of the non-pathologic protein and the causes of the disease.


Conflict of interest statement

Competing Interests: The authors have declared that no competing interests exist.

Figures

Figure 1
Figure 1. Sequence analysis.
A. Schematic representation of the Atx1 architecture. The positions of the polyQ tract (Q) and of the AXH motif are indicated as well as S776. B. Alignment of the ULM motif in Atx1 orthologs and of the corresponding Boat sequences. The alignment was coloured according to standard coding. Sequence numbering follows human Atx1.
Figure 2
Figure 2. Mapping the effect of Atx1 peptides on U2AF65.
Weighted chemical shift perturbation of U2AF65 upon titration with Atx1_S_ULM_PE (upper panel) and Atx1_pS_ULM_PE (lower panel). The U2AF65 sequence and secondary structure elements are indicated.
Figure 3
Figure 3. Interaction of Atx1 with U2AF65.
A. Co-localization of Atx1 with endogenous U2AF65 in HeLa cells transfected with RFP-tagged Atx1 constructs and analysed by confocal microscopy. Non-expanded (30Q) or expanded Atx1 (82Q) (red) co-localized with endogenous U2AF65 (green), as evidenced by the merged images. B. Interaction of Atx1 with endogenous U2AF65 in HeLa cells. HeLa cells were transfected with flag tagged non-expanded Atx1 (lane 1), expanded Atx1 (lane 2) or empty pCMV constructs (lane 3). Lysates from these cells were immunoprecipitated with anti-flag or anti-U2AF65 antibodies. Pelleted samples were analysed by western blot using anti-U2AF65 and anti-flag antibodies (IP). 5% of the lysates from transfected cells were analysed by western blot using respective antibodies (Input). Molecular weight markers are shown on the left. C. Association of Atx1 with U2AF65 in cerebellum extracts from mouse brain. The extracts were subjected to immunoprecipitation with anti-Atx1 antibodies, anti-U2AF65 antibodies or control anti-flag antibodies. 2.5% of pelleted complexes from anti-U2AF65 IP (lane 1) and 25% from anti-flag IP (lane 2) and anti-Atx1 IP (lane 3) were subjected to PAGE and Western blot analysis using anti- U2AF65 antibodies. 2.5% of pelleted complexes from anti-Atx1 IP (lane 4) and 25% from anti-flag IP (lane 5) and anti-U2AF65 IP (lane 6) were subjected to PAGE and Western blot analysis using anti-Atx1 antibodies. D. Atx1 does not localize with a nuclear speckle marker. HeLa cells were transfected with RFP-tagged non-expanded (30Q) or expanded (82Q) Atx1 (red). Cells were fixed, permeabilized and stained with anti-SC-35 antibodies followed by FITC conjugated secondary antibodies (green). Merged images indicate that neither forms of Atx1 co-localize to the speckles defined by SC-35.
Figure 4
Figure 4. Effect of Atx1 overexpression on alternative splicing of pyPY.
A. Alternatively spliced transcripts from cells expressing the pyPY minigene. 293T Cells were transfected with the pyPY reporter minigene plasmid. RNA was isolated 24 h post transfection and RT- PCR analysis was carried out. The predicted alternatively spliced and unspliced primary transcripts are shown on the right by diagrams in which the exons and introns are symbolised by boxes and lines, respectively. Molecular weight markers are indicated on the left. B. Schematic representation of the positions of forward (For) and reverse (Rev) primers used in Quantitative RT-PCR analysis. C. Quantitative RT-PCR analysis of the expression levels of transcripts. 293T cells were transfected with pyPY reporter minigene plasmid together with empty pCMV vector (bar 1), GFP-U2AF65 (bar 2), flag-30Q-Atx1 (bar 3), flag-82Q-Atx1 (bar 4), GFP-U2AF65 and flag-30Q-Atx1 (bar 5) or GFP-U2AF65 and flag-Atx1 82Q plasmids (bar 6). Total RNA was isolated from the cells 24 h post transfection and quantitative RT-PCR analysis using the primer sets shown in B was carried out. The histogram shows the ratios between the isoform levels (py/PY). Values are mean ± standard deviation from four experiments. §§ indicates P<0.01 GFP-U2AF65 and flag-30Q-Atx1 vs GFP-U2AF65 alone; * indicates P<0.05 flag-30Q-Atx1 vs empty pCMV vector. Statistical significance was evaluated with One-way analysis of variance followed by Turkey's Multiple Comparison Test. D. Expression of proteins in 293T cells transfected with reporter minigene, U2AF65 and Atx1 constructs. Lanes 1 to 6 correspond to bars 1 to 6 shown in C. Cell extracts were prepared 24 h after transfection and the proteins were analysed by Western blotting with indicated antibodies. Molecular weight markers are indicated on the left.
Figure 5
Figure 5. Testing competition of Atx1_pS_ULM_PE binding to 14-3-3ζ and U2AF65_UHM.
15N labeled U2AF65_UHM saturated with unlabelled Atx1_pS_ULM_PE was titrated with unlabelled 14-3-3ζ. The HSQC spectra of U2AF65 UHM in its free form (red), saturated with a 2 fold molar excess of Atx1_pS_ULM_PE (green) and saturated with a 1∶1 14-3-3ζ/Atx1_pS_ULM_PE mixture in a 2 fold molar excess to U2AF65 UHM (blue) are compared.
Figure 6
Figure 6. Structural models of U2AF65 and SPF45 in complex with the Atx1 native and S776D mutant ULMs.
The structures of 1opi and 2peh were used as homology modeling templates for the complexes of U2AF65 (left) and SPF45 (right), respectively. In the 1opi complex (left), the SF1 ULM peptide (PSKKRRKRSRWNQD) contains an Asn in correspondence to Atx1_ULM S776. The top panel shows a blow-up of the peptide and of R452 and K453 in the same orientation as shown below. The residue does not pack against the protein and is exposed. In the 2peh complex (right), the aspartate in position W+1 of the SF3b155 ULM5 peptide (KRKSRWDETP) hydrogen bond with the spatially close R375 of SPF45. These coordinates are therefore more appropriate to model the structure of the S776D mutant. The top panel shows a blow-up of the hydrogen bond between S776D with the side chain of R375, as rotated by −90 degrees around the y axis.
Figure 7
Figure 7. Schematic model of the cellular interactions formed by Atx1 and the role that phosphorylation plays in pathology.
S776 phosphorylation would be at the crossing point of two different pathways. When Atx1 (blue oval) is not phosphorylated, it interacts with the spliceosome (light blue shape) and is protected from aggregation. Phosphorylated Atx1 has higher affinity to 14-3-3 proteins but is not protected against self-association. In vitro, the Ala mutant mimics correctly the properties of non-phosphorylated Atx1, whereas the Asp mutant, which has properties very different from the phosphorylated sequence, is not recognized by 14-3-3.

Similar articles

Cited by

References

    1. Banfi S, Servadio A, Chung MY, Kwiatkowski TJ, Jr, McCall AE, et al. Identification and characterization of the gene causing type 1 spinocerebellar ataxia. Nature genetics. 1994;7:513–520. - PubMed
    1. Jodice C, Malaspina P, Persichetti F, Novelletto A, Spadaro M, et al. Effect of trinucleotide repeat length and parental sex on phenotypic variation in spinocerebellar ataxia I. American journal of human genetics. 1994;54:959–965. - PMC - PubMed
    1. Orr HT, Zoghbi HY. SCA1 molecular genetics: a history of a 13 year collaboration against glutamines. Human molecular genetics. 2001;10:2307–2311. - PubMed
    1. Heintz N. Biomedicine. Ataxin-1 regulators in the spotlight. Science (New York, NY. 2003;301:59–60. - PubMed
    1. Liu N, Bonini NM. Hosting neurotoxicity in polyglutamine disease. Cell. 2006;127:1299–1300. - PubMed

Publication types

MeSH terms

LinkOut - more resources