Aging reveals a role for nigral tyrosine hydroxylase ser31 phosphorylation in locomotor activity generation
- PMID: 20037632
- PMCID: PMC2791868
- DOI: 10.1371/journal.pone.0008466
Aging reveals a role for nigral tyrosine hydroxylase ser31 phosphorylation in locomotor activity generation
Abstract
Background: Tyrosine hydroxylase (TH) regulates dopamine (DA) bioavailability. Its product, L-DOPA, is an established treatment for Parkinson's disease (PD), suggesting that TH regulation influences locomotion. Site-specific phosphorylation of TH at ser31 and ser40 regulates activity. No direct evidence shows that ser40 phosphorylation is the dominating mechanism of regulating TH activity in vivo, and physiologically-relevant stimuli increase L-DOPA biosynthesis independent of ser40 phosphorylation. Significant loss of locomotor activity occurs in aging as in PD, despite less loss of striatal DA or TH in aging compared to the loss associated with symptomatic PD. However, in the substantia nigra (SN), there is equivalent loss of DA or TH in aging and at the onset of PD symptoms. Growth factors increase locomotor activity in both PD and aging models and increase DA bioavailability and ser31 TH phosphorylation in SN, suggesting that ser31 TH phosphorylation status in the SN, not striatum, regulates DA bioavailability necessary for locomotor activity.
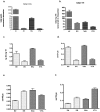
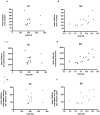
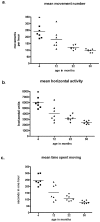
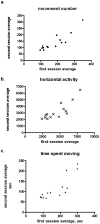
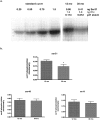
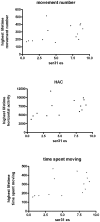
Methodology and principal findings: We longitudinally characterized locomotor activity in young and older Brown-Norway Fischer 344 F(1) hybrid rats (18 months apart in age) at two time periods, eight months apart. The aged group served as an intact and pharmacologically-naïve source of deficient locomotor activity. Following locomotor testing, we analyzed DA tissue content, TH protein, and TH phosphorylation in striatum, SN, nucleus accumbens, and VTA. Levels of TH protein combined with ser31 phosphorylation alone reflected inherent differences in DA levels among the four regions. Measures strictly pertaining to locomotor activity initiation significantly correlated to DA content only in the SN. Nigral TH protein and ser31 phosphorylation together significantly correlated to test subject's maximum movement number, horizontal activity, and duration.
Conclusions/significance: Together, these results show ser31 TH phosphorylation regulates DA bioavailability in intact neuropil, its status in the SN may regulate locomotor activity generation, and it may represent an accurate target for treating locomotor deficiency. They also show that neurotransmitter regulation in cell body regions can mediate behavioral outcomes and that ser31 TH phosphorylation plays a role in behaviors dependent upon catecholamines, such as dopamine.
Conflict of interest statement
Figures



Similar articles
-
Dichotomy of tyrosine hydroxylase and dopamine regulation between somatodendritic and terminal field areas of nigrostriatal and mesoaccumbens pathways.PLoS One. 2012;7(1):e29867. doi: 10.1371/journal.pone.0029867. Epub 2012 Jan 5. PLoS One. 2012. PMID: 22242182 Free PMC article.
-
ser31 Tyrosine hydroxylase phosphorylation parallels differences in dopamine recovery in nigrostriatal pathway following 6-OHDA lesion.J Neurochem. 2014 May;129(3):548-58. doi: 10.1111/jnc.12652. Epub 2014 Jan 27. J Neurochem. 2014. PMID: 24410633 Free PMC article.
-
Nigral GFRα1 infusion in aged rats increases locomotor activity, nigral tyrosine hydroxylase, and dopamine content in synchronicity.Mol Neurobiol. 2013 Jun;47(3):988-99. doi: 10.1007/s12035-013-8397-7. Epub 2013 Jan 16. Mol Neurobiol. 2013. PMID: 23321789 Free PMC article.
-
Dopamine Signaling in Substantia Nigra and Its Impact on Locomotor Function-Not a New Concept, but Neglected Reality.Int J Mol Sci. 2024 Jan 17;25(2):1131. doi: 10.3390/ijms25021131. Int J Mol Sci. 2024. PMID: 38256204 Free PMC article. Review.
-
Human tyrosine hydroxylase in Parkinson's disease and in related disorders.J Neural Transm (Vienna). 2019 Apr;126(4):397-409. doi: 10.1007/s00702-018-1903-3. Epub 2018 Jul 11. J Neural Transm (Vienna). 2019. PMID: 29995172 Review.
Cited by
-
Phosphodiesterase inhibition and Gucy2C activation enhance tyrosine hydroxylase Ser40 phosphorylation and improve 6-hydroxydopamine-induced motor deficits.Cell Biosci. 2024 Oct 25;14(1):132. doi: 10.1186/s13578-024-01312-7. Cell Biosci. 2024. PMID: 39456033 Free PMC article.
-
Prolonged increase in ser31 tyrosine hydroxylase phosphorylation in substantia nigra following cessation of chronic methamphetamine.Neurotoxicology. 2018 Jul;67:121-128. doi: 10.1016/j.neuro.2018.05.003. Epub 2018 May 18. Neurotoxicology. 2018. PMID: 29782882 Free PMC article.
-
Aging-related limit of exercise efficacy on motor decline.PLoS One. 2017 Nov 27;12(11):e0188538. doi: 10.1371/journal.pone.0188538. eCollection 2017. PLoS One. 2017. PMID: 29176896 Free PMC article.
-
Dichotomy of tyrosine hydroxylase and dopamine regulation between somatodendritic and terminal field areas of nigrostriatal and mesoaccumbens pathways.PLoS One. 2012;7(1):e29867. doi: 10.1371/journal.pone.0029867. Epub 2012 Jan 5. PLoS One. 2012. PMID: 22242182 Free PMC article.
-
mTORC2/rictor signaling disrupts dopamine-dependent behaviors via defects in striatal dopamine neurotransmission.J Neurosci. 2015 Jun 10;35(23):8843-54. doi: 10.1523/JNEUROSCI.0887-15.2015. J Neurosci. 2015. PMID: 26063917 Free PMC article.
References
-
- Bennet DA, Beckett LA, Murray AM, Shannon KM, Goetz CG, et al. Prevalence of Parkinsonian signs and associated mortality in a community population of older people. New England J Med. 1996;334:71–76. - PubMed
-
- Prettyman R. Extrapyramidal signs in cognitively intact elderly people. Age and Ageing. 1998;27:557–560. - PubMed
-
- Fleischman DA, Wilson RS, Schneider JA, Beinias JL, Bennet DA. Parkinsonian signs and functional disability in old age. Exp Aging Res. 2007;33:59–76. - PubMed
-
- Murray AM, Bennett DA, Mendes de Leon CF, Beckett LA, Evans DA. A longitudinal study of Parkinsonism and disability in a community population of older people. J Gerontol: Medical Sciences. 2004;59A:864–870. - PubMed
Publication types
MeSH terms
Substances
LinkOut - more resources
Full Text Sources
Other Literature Sources
Medical
Molecular Biology Databases

