

Intraclonal protein expression heterogeneity in recombinant CHO cells
- PMID: 20037651
- PMCID: PMC2793030
- DOI: 10.1371/journal.pone.0008432
Intraclonal protein expression heterogeneity in recombinant CHO cells
Abstract
Therapeutic glycoproteins have played a major role in the commercial success of biotechnology in the post-genomic era. But isolating recombinant mammalian cell lines for large-scale production remains costly and time-consuming, due to substantial variation and unpredictable stability of expression amongst transfected cells, requiring extensive clone screening to identify suitable high producers. Streamlining this process is of considerable interest to industry yet the underlying phenomena are still not well understood. Here we examine an antibody-expressing Chinese hamster ovary (CHO) clone at single-cell resolution using flow cytometry and vectors, which couple light and heavy chain transcription to fluorescent markers. Expression variation has traditionally been attributed to genetic heterogeneity arising from random genomic integration of vector DNA. It follows that single cell cloning should yield a homogeneous cell population. We show, in fact, that expression in a clone can be surprisingly heterogeneous (standard deviation 50 to 70% of the mean), approaching the level of variation in mixed transfectant pools, and each antibody chain varies in tandem. Phenotypic variation is fully developed within just 18 days of cloning, yet is not entirely explained by measurement noise, cell size, or the cell cycle. By monitoring the dynamic response of subpopulations and subclones, we show that cells also undergo slow stochastic fluctuations in expression (half-life 2 to 11 generations). Non-genetic diversity may therefore play a greater role in clonal variation than previously thought. This also has unexpected implications for expression stability. Stochastic gene expression noise and selection bias lead to perturbations from steady state at the time of cloning. The resulting transient response as clones reestablish their expression distribution is not ordinarily accounted for but can contribute to declines in median expression over timescales of up to 50 days. Noise minimization may therefore be a novel strategy to reduce apparent expression instability and simplify cell line selection.
Conflict of interest statement
Figures
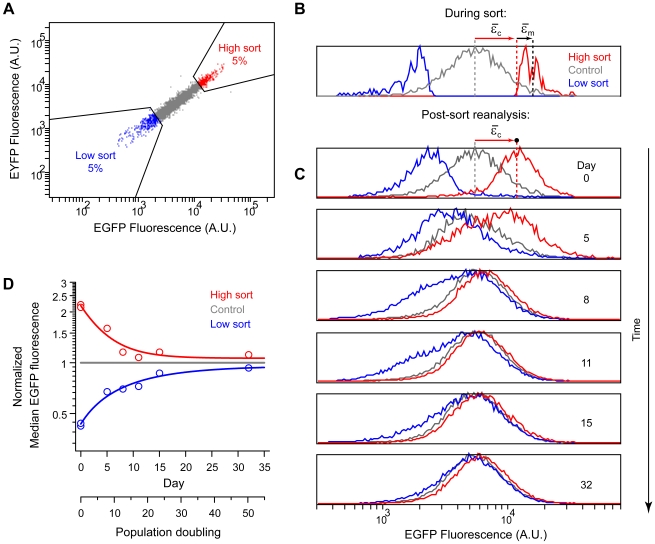
 ) and measurement noise (
 ) in the high subpopulation are indicated by red and black arrows, respectively. Measurement noise was estimated to be ∼30% of total variation (Methods). The low subpopulation and EYFP channel yielded similar estimates (not shown). Data is from two independent sorting runs. Fluorescence in arbitrary units (A.U.). D) Median fluorescence for each subpopulation was normalized to the control and plotted as a function of time (open circles). Relaxation half times (
 ) were estimated by fitting a first order exponential decay (lines).
  (high sort) = 3 days (∼5 generations);
  (low sort) = 7 days (∼11 generations). EYFP similar (not shown).
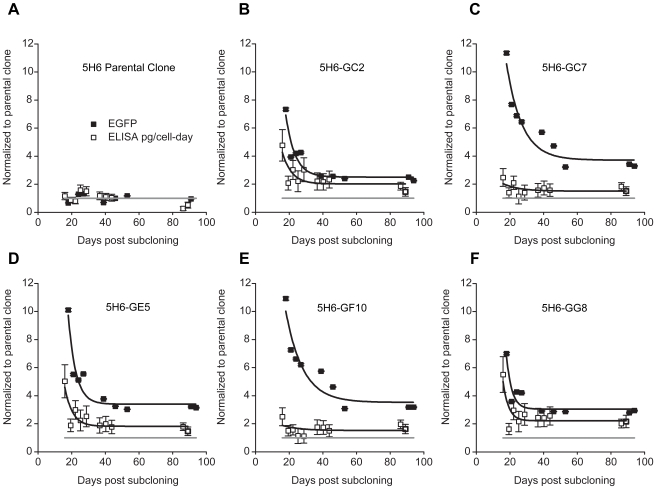
 for subclones 5H6-GC2, -GC7, -GE5, -GF10, and -GG8 were 4 days (∼4 generations), 6 days (∼7 generations), 3 days (∼4 generations), 7 days (∼7 generations) and 2 days (∼2 generations), respectively. EYFP similar (not shown).
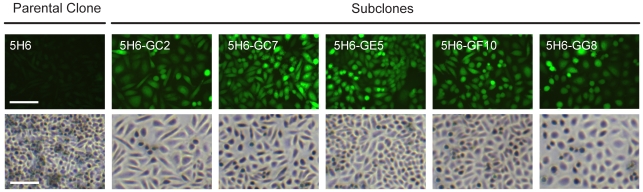
Similar articles
-
Increased recombinant protein production owing to expanded opportunities for vector integration in high chromosome number Chinese hamster ovary cells.J Biosci Bioeng. 2016 Aug;122(2):226-31. doi: 10.1016/j.jbiosc.2016.01.002. Epub 2016 Feb 2. J Biosci Bioeng. 2016. PMID: 26850366
-
The PiggyBac transposon enhances the frequency of CHO stable cell line generation and yields recombinant lines with superior productivity and stability.Biotechnol Bioeng. 2011 Sep;108(9):2141-50. doi: 10.1002/bit.23167. Epub 2011 Apr 25. Biotechnol Bioeng. 2011. PMID: 21495018
-
Early prediction of instability of Chinese hamster ovary cell lines expressing recombinant antibodies and antibody-fusion proteins.Biotechnol Bioeng. 2012 Apr;109(4):1016-30. doi: 10.1002/bit.24367. Epub 2011 Dec 1. Biotechnol Bioeng. 2012. PMID: 22068683
-
The use of site-specific recombination and cassette exchange technologies for monoclonal antibody production in Chinese Hamster ovary cells: retrospective analysis and future directions.Crit Rev Biotechnol. 2020 Sep;40(6):833-851. doi: 10.1080/07388551.2020.1768043. Epub 2020 May 26. Crit Rev Biotechnol. 2020. PMID: 32456474 Review.
-
When will we have a clone? An industry perspective on the typical CLD timeline.Biotechnol Prog. 2024 Jul-Aug;40(4):e3449. doi: 10.1002/btpr.3449. Epub 2024 Mar 13. Biotechnol Prog. 2024. PMID: 38477447 Review.
Cited by
-
Generation and screening of Pichia pastoris strains with enhanced protein production by use of microengraving.Appl Environ Microbiol. 2011 May;77(9):3154-6. doi: 10.1128/AEM.00104-11. Epub 2011 Mar 4. Appl Environ Microbiol. 2011. PMID: 21378037 Free PMC article.
-
Calcium dynamics and chromatin remodelling underlie heterogeneity in prolactin transcription.J Mol Endocrinol. 2021 Jan;66(1):59-69. doi: 10.1530/JME-20-0223. J Mol Endocrinol. 2021. PMID: 33112804 Free PMC article.
-
Comprehensive genome and epigenome characterization of CHO cells in response to evolutionary pressures and over time.Biotechnol Bioeng. 2016 Oct;113(10):2241-53. doi: 10.1002/bit.25990. Epub 2016 Apr 29. Biotechnol Bioeng. 2016. PMID: 27072894 Free PMC article.
-
Genomic barcoding for clonal diversity monitoring and control in cell-based complex antibody production.Sci Rep. 2024 Jun 25;14(1):14587. doi: 10.1038/s41598-024-65323-7. Sci Rep. 2024. PMID: 38918509 Free PMC article.
-
Mitochondrial temperature homeostasis resists external metabolic stresses.Elife. 2023 Dec 11;12:RP89232. doi: 10.7554/eLife.89232. Elife. 2023. PMID: 38079477 Free PMC article.
References
-
- Walsh G, Jefferis R. Post-translational modifications in the context of therapeutic proteins. Nat Biotechnol. 2006;24:1241–1252. - PubMed
-
- Jayapal KR, Wlaschin KF, Hu WS, Yap MGS. Recombinant protein therapeutics from CHO cells - 20 years and counting. Chemical Engineering Progress. 2007;103:40–47.
-
- Schirrmann T, Al-Halabi L, Dubel S, Hust M. Production systems for recombinant antibodies. Front Biosci. 2008;13:4576–4594. - PubMed
-
- Kim NS, Kim SJ, Lee GM. Clonal variability within dihydrofolate reductase-mediated gene amplified Chinese hamster ovary cells: stability in the absence of selective pressure. Biotechnol Bioeng. 1998;60:679–688. - PubMed
-
- Barnes LM, Bentley CM, Dickson AJ. Stability of protein production from recombinant mammalian cells. Biotechnol Bioeng. 2003;81:631–639. - PubMed
Publication types
MeSH terms
Substances
LinkOut - more resources
Full Text Sources
Other Literature Sources
