

Explaining The Current Role Of High Frequency Ultrasound In Ophthalmic Diagnosis (Ophthalmic Ultrasound)
- PMID: 20037660
- PMCID: PMC2796804
- DOI: 10.1586/17469899.1.1.63
Explaining The Current Role Of High Frequency Ultrasound In Ophthalmic Diagnosis (Ophthalmic Ultrasound)
Abstract
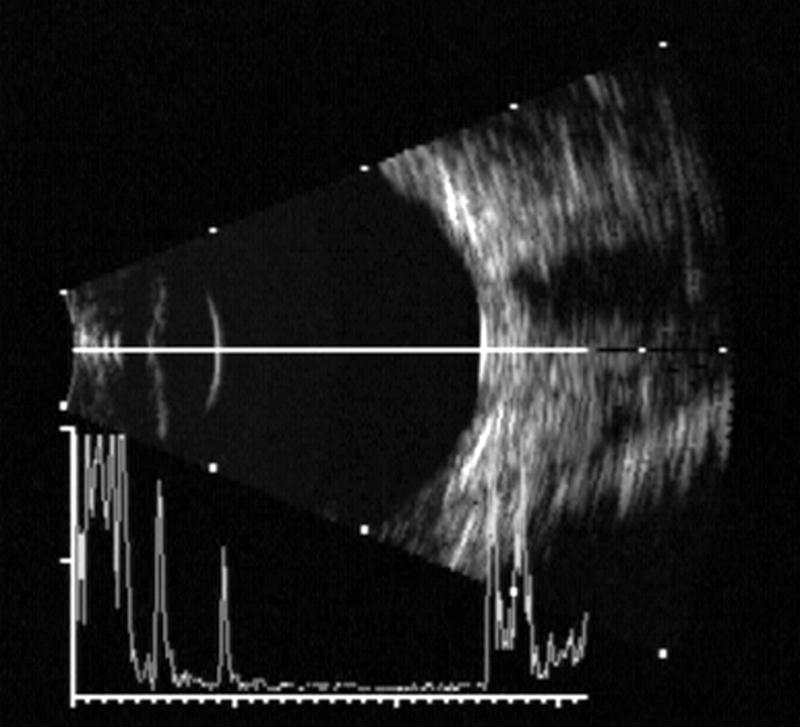
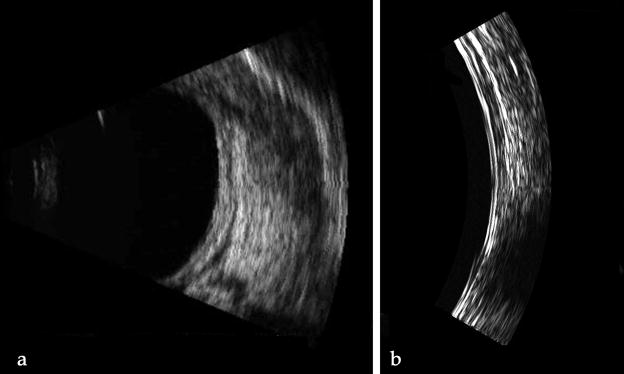
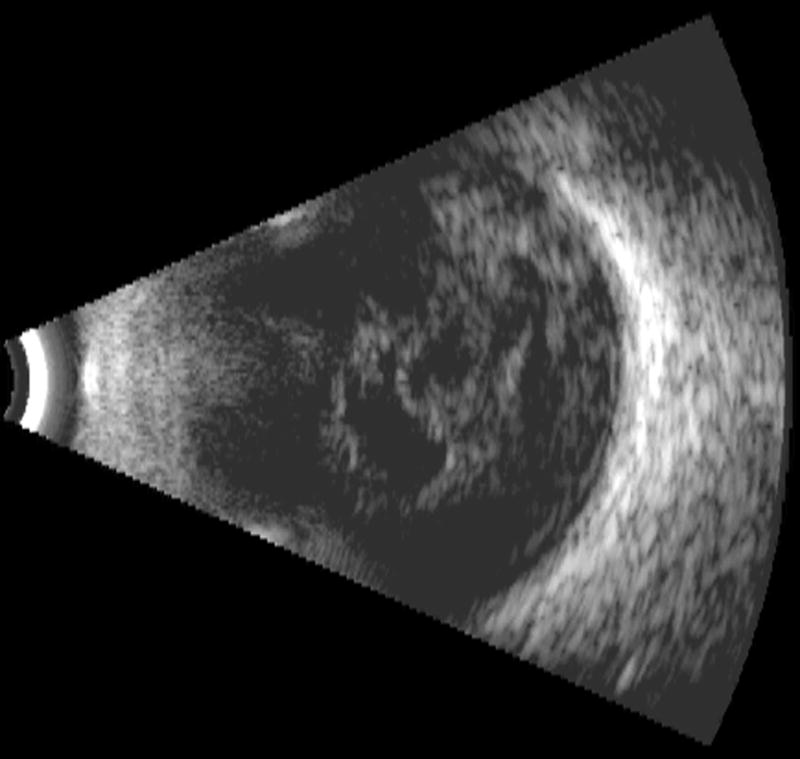
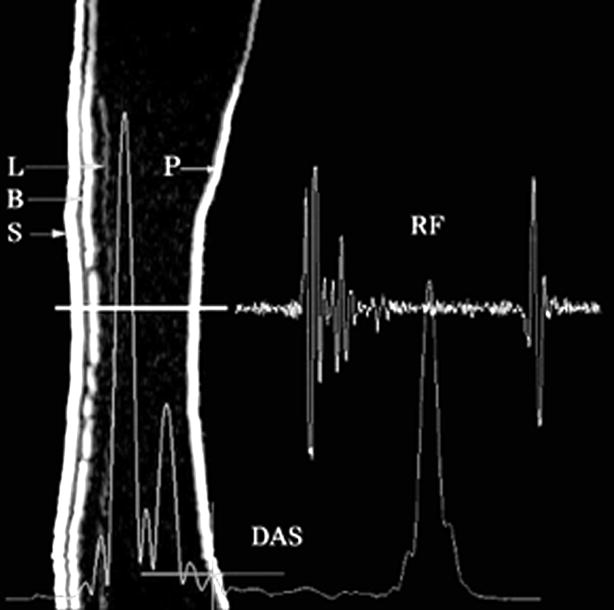
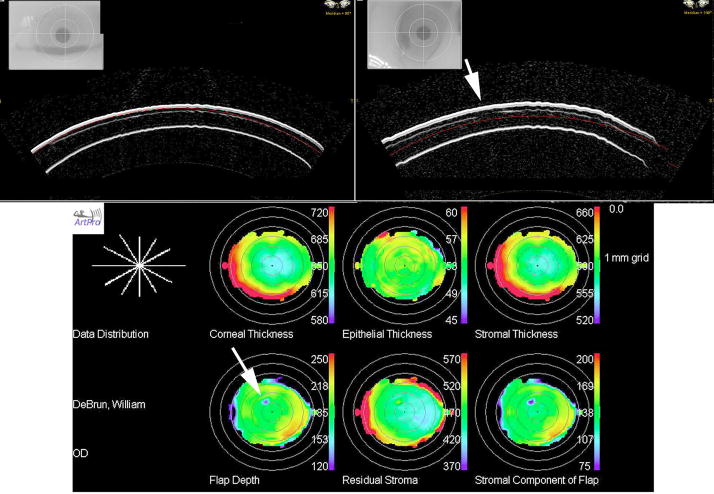
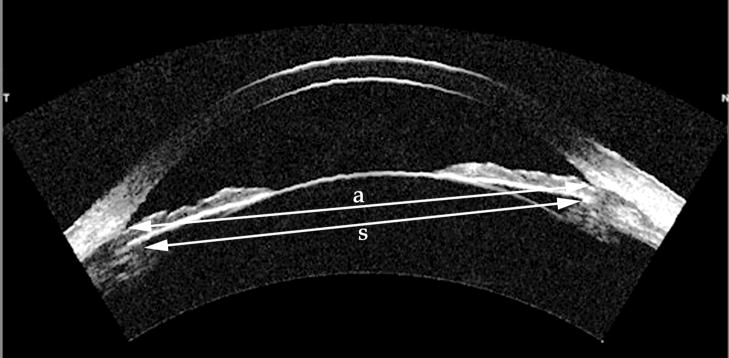
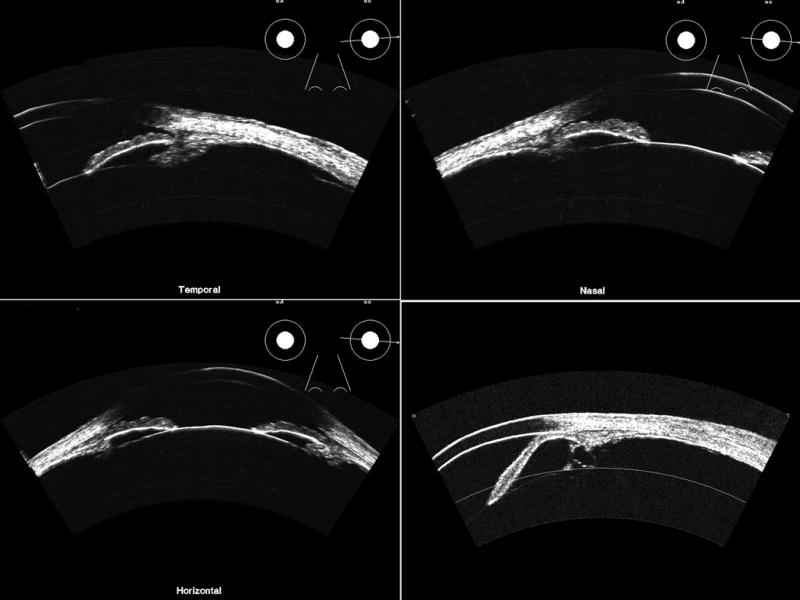
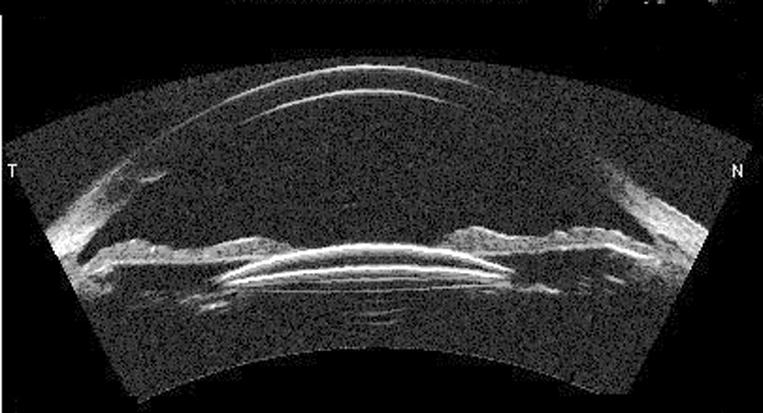
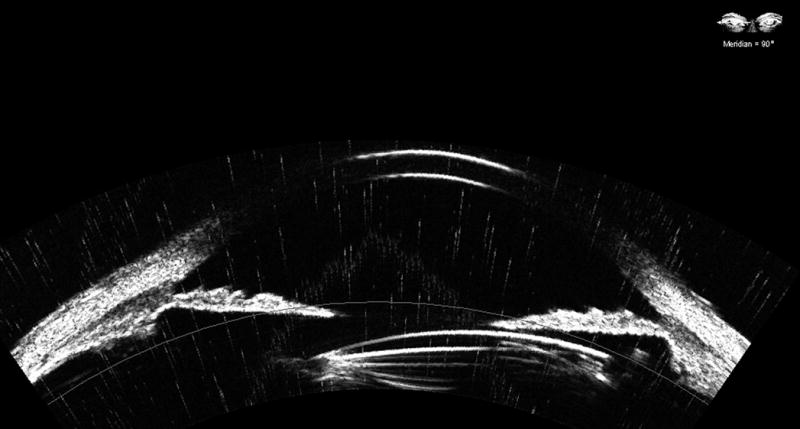
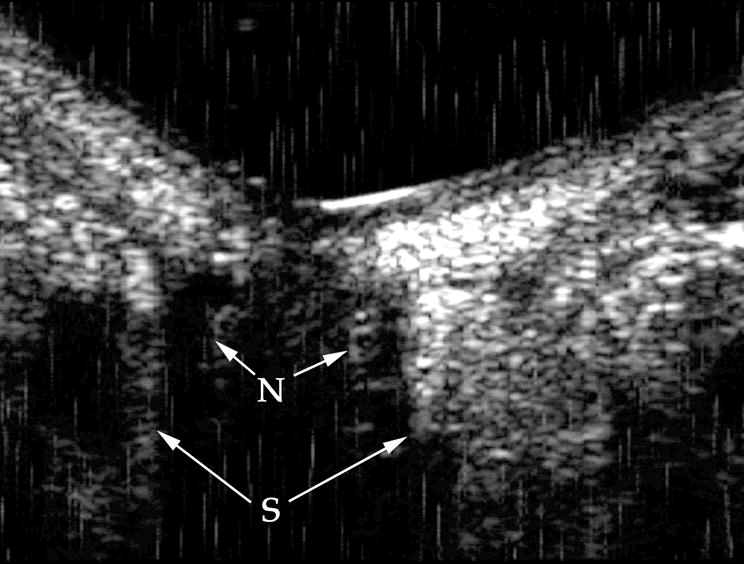
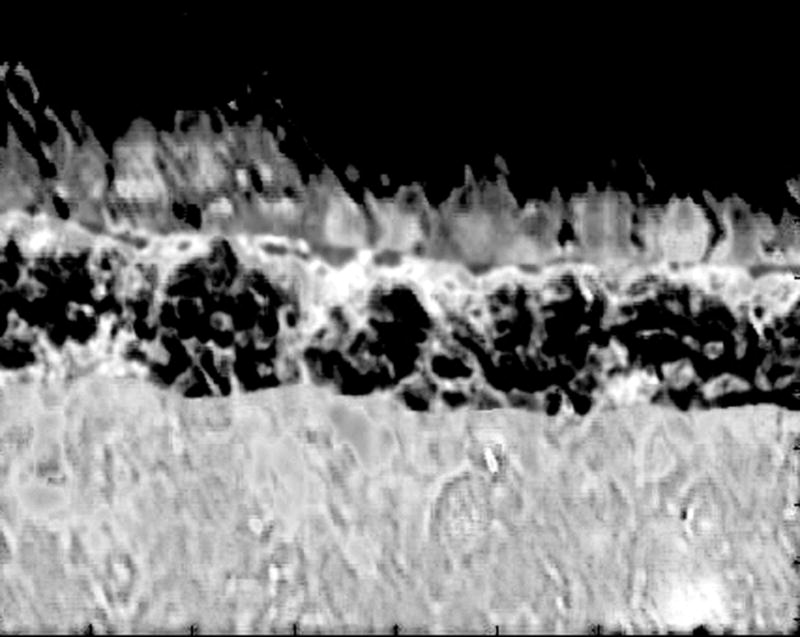
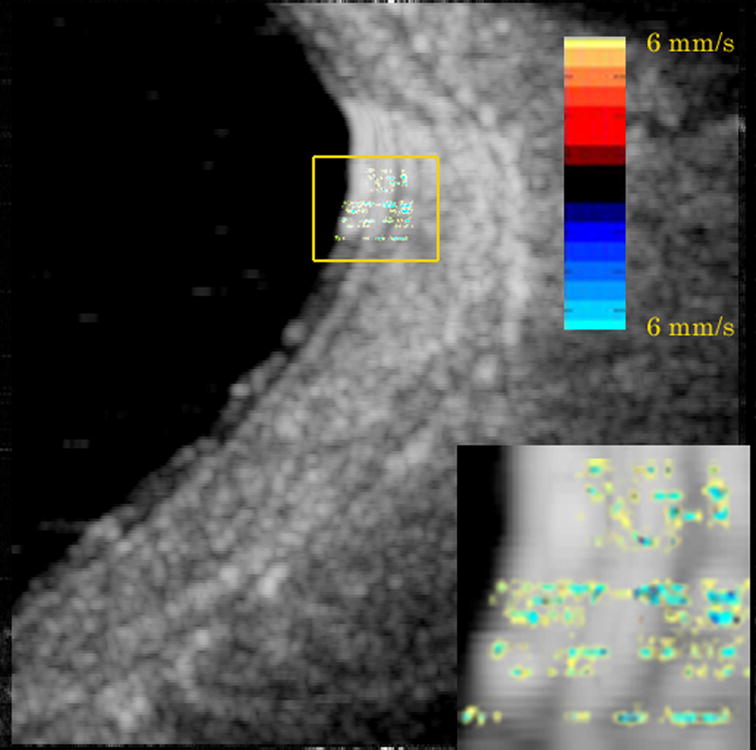
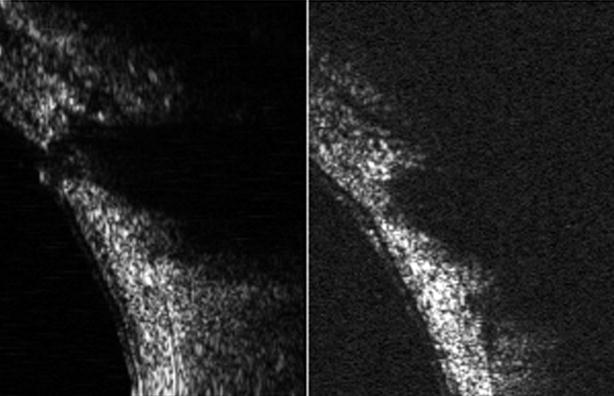
Ultrasound has become as indispensable as indirect ophthalmoscopy or slit lamp in evaluation of the eye. It is an important adjuvant for the clinical assessment of a variety of ocular and orbital diseases. Advances in instrumentation, higher frequencies and more sensitivity and resolution have resulted in continuous improvement in image quality.Very high frequency ultrasound uses frequencies in the range of 35 to 100 MHz to show greater detail of the anterior segment. Penetration is limited for these higher frequencies to only a few millimeters and thus only the anterior vitreous behind the ciliary body and lens can be imaged. High frequency ultrasound in the range of 20 to 30 MHz has a penetration of about 10 mm and can be used for posterior pole evaluation of the retina and choroid.
Figures
Similar articles
-
Ocular ultrasonography focused on the posterior eye segment: what radiologists should know.Insights Imaging. 2016 Jun;7(3):351-64. doi: 10.1007/s13244-016-0471-z. Epub 2016 Feb 24. Insights Imaging. 2016. PMID: 26910565 Free PMC article. Review.
-
High-resolution ultrasonic imaging of the posterior segment.Ophthalmology. 2004 Jul;111(7):1344-51. doi: 10.1016/j.ophtha.2003.10.029. Ophthalmology. 2004. PMID: 15234135
-
Ultrasound biomicroscopy for detection of breaks and detachment of the ciliary epithelium.Am J Ophthalmol. 1999 Oct;128(4):466-71. doi: 10.1016/s0002-9394(99)00188-9. Am J Ophthalmol. 1999. PMID: 10577587
-
Peering into the eye: A comprehensive look at ultrasound biomicroscopy (UBM) and its diagnostic value in anterior segment disorders.Indian J Ophthalmol. 2023 Aug;71(8):3118-3119. doi: 10.4103/IJO.IJO_608_23. Indian J Ophthalmol. 2023. PMID: 37530300 Free PMC article.
-
Ultrasound biomicroscopy of the anterior segment.J Am Optom Assoc. 1996 Aug;67(8):469-79. J Am Optom Assoc. 1996. PMID: 8888877 Review.
Cited by
-
Ultrasound Biomicroscopy for the Detection and Characterization of Anterior Segment Cysticercosis.Clin Ophthalmol. 2024 Nov 25;18:3441-3448. doi: 10.2147/OPTH.S494556. eCollection 2024. Clin Ophthalmol. 2024. PMID: 39618987 Free PMC article.
-
Magnetic Resonance Imaging in the Clinical Care for Uveal Melanoma Patients-A Systematic Review from an Ophthalmic Perspective.Cancers (Basel). 2023 May 30;15(11):2995. doi: 10.3390/cancers15112995. Cancers (Basel). 2023. PMID: 37296958 Free PMC article. Review.
-
Quantitative Ultrasound Techniques Used for Peripheral Nerve Assessment.Diagnostics (Basel). 2023 Mar 2;13(5):956. doi: 10.3390/diagnostics13050956. Diagnostics (Basel). 2023. PMID: 36900101 Free PMC article. Review.
-
A systematic review of ultrasound-mediated drug delivery to the eye and critical insights to facilitate a timely path to the clinic.Theranostics. 2023 Jun 19;13(11):3582-3638. doi: 10.7150/thno.82884. eCollection 2023. Theranostics. 2023. PMID: 37441595 Free PMC article.
-
Ocular ultrasonography focused on the posterior eye segment: what radiologists should know.Insights Imaging. 2016 Jun;7(3):351-64. doi: 10.1007/s13244-016-0471-z. Epub 2016 Feb 24. Insights Imaging. 2016. PMID: 26910565 Free PMC article. Review.
References
-
- Coleman DJ, Silverman RH, Lizzi FL, Rondeau MJ. Ultrasonography of the Eye and Orbit. 2. Lippincott Williams & Wilkins; Philadelphia: 2005. Essential for understanding physics, instrumentation and applications of ophthalmic ultrasonography.
-
- Baikoff G, Lutun E, Ferraz C, Wei J. Analysis of the eye’s anterior segment with optical coherence tomography. Static and dynamic study. J Fr Ophtalmol. 2005;28(4):343–52. - PubMed
-
- Coleman DJ, Silverman RH, Chabi A, Rondeau MJ, Shung KK, Cannata J, Lincoff H. High-resolution ultrasonic imaging of the posterior segment. Ophthalmology. 2004;111(7):1344–51. Explores the use of higher frequency ultrasound to provide improved resolution of the posterior pole. - PubMed
-
- Pavlin CJ, Foster FS. Ultrasound biomicroscopy. High-frequency ultrasound imaging of the eye at microscopic resolution. Radiol Clin North Am. 1998;36:1047–58. First paper published that describes imaging the anterior segment of the eye at high resolution. - PubMed
-
- Reinstein DZ, Silverman RH, Rondeau MJ, Coleman DJ. Epithelial and corneal thickness measurements by high-frequency ultrasound digital signal processing. Ophthalmology. 1994;101(1):140–6. - PubMed
Grants and funding
LinkOut - more resources
Full Text Sources
Other Literature Sources