Transient anomalous subdiffusion: effects of specific and nonspecific probe binding with actin gels
- PMID: 20038146
- PMCID: PMC2810870
- DOI: 10.1021/jp9072153
Transient anomalous subdiffusion: effects of specific and nonspecific probe binding with actin gels
Abstract
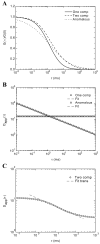
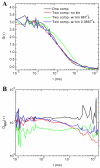
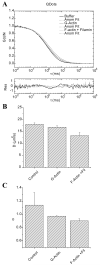
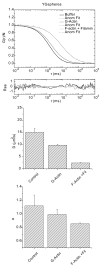
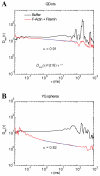
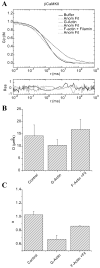
When signaling molecules diffuse through the cytosol, they encounter a wide variety of obstacles that hinder their mobility in space and time. Some of those factors include, but are not limited to, interactions with mobile and immobile targets or obstacles. Besides finding a crowded environment inside the cell, macromolecules assemble into molecular complexes that drive specific biological functions adding additional complexity to their diffusion. Thus, simple models of diffusion often fail to explain mobility through the cell interior, and new approaches are needed. Here we used fluorescent correlation spectroscopy to measure diffusion of three molecules of similar size with different surface properties diffusing in actin gels. The fluorescent probes were (a) quantum dots, (b) yellow-green fluorescent spheres, and (c) the beta isoform of Ca(2+) calmodulin-dependent protein kinase II tagged with green fluorescent protein. We compared various models for fitting the autocorrelation function (ACF) including single component, two-component, and anomalous diffusion. The two-component and anomalous diffusion models were superior and were largely indistinguishable based on a goodness of fit criteria. To better resolve differences between these two models, we modified the ACF to observe temporal variations in diffusion. We found in both simulated and experimental data a transient anomalous subdiffusion between two freely diffusing regimes produced by binding interactions of the diffusive tracers with actin gels.
Figures



Similar articles
-
Wanted: a positive control for anomalous subdiffusion.Biophys J. 2012 Dec 19;103(12):2411-22. doi: 10.1016/j.bpj.2012.10.038. Epub 2012 Dec 18. Biophys J. 2012. PMID: 23260043 Free PMC article. Review.
-
Multiple diffusion mechanisms due to nanostructuring in crowded environments.Biophys J. 2007 Jan 1;92(1):313-22. doi: 10.1529/biophysj.106.090498. Epub 2006 Oct 13. Biophys J. 2007. PMID: 17040979 Free PMC article.
-
Macromolecular crowding: chemistry and physics meet biology (Ascona, Switzerland, 10-14 June 2012).Phys Biol. 2013 Aug;10(4):040301. doi: 10.1088/1478-3975/10/4/040301. Epub 2013 Aug 2. Phys Biol. 2013. PMID: 23912807
-
Anomalous diffusion of fluorescent probes inside living cell nuclei investigated by spatially-resolved fluorescence correlation spectroscopy.J Mol Biol. 2000 May 12;298(4):677-89. doi: 10.1006/jmbi.2000.3692. J Mol Biol. 2000. PMID: 10788329
-
Non-Brownian diffusion in lipid membranes: Experiments and simulations.Biochim Biophys Acta. 2016 Oct;1858(10):2451-2467. doi: 10.1016/j.bbamem.2016.01.022. Epub 2016 Jan 28. Biochim Biophys Acta. 2016. PMID: 26826272 Review.
Cited by
-
Bridging the spatiotemporal scales of macromolecular transport in crowded biomimetic systems.Soft Matter. 2019 Feb 6;15(6):1200-1209. doi: 10.1039/c8sm02023j. Soft Matter. 2019. PMID: 30543245 Free PMC article.
-
Particle transport through hydrogels is charge asymmetric.Biophys J. 2015 Feb 3;108(3):530-9. doi: 10.1016/j.bpj.2014.12.009. Biophys J. 2015. PMID: 25650921 Free PMC article.
-
Wanted: a positive control for anomalous subdiffusion.Biophys J. 2012 Dec 19;103(12):2411-22. doi: 10.1016/j.bpj.2012.10.038. Epub 2012 Dec 18. Biophys J. 2012. PMID: 23260043 Free PMC article. Review.
-
Filament Rigidity Vies with Mesh Size in Determining Anomalous Diffusion in Cytoskeleton.Biomacromolecules. 2019 Dec 9;20(12):4380-4388. doi: 10.1021/acs.biomac.9b01057. Epub 2019 Nov 15. Biomacromolecules. 2019. PMID: 31687803 Free PMC article.
References
-
- Minton AP. The influence of macromolecular crowding and macromolecular confinement on biochemical reactions in physiological media. J Biol Chem. 2001;276:10577–10580. - PubMed
-
- Marsh BJ, Mastronarde DN, McIntosh JR, Howell KE. Structural evidence for multiple transport mechanisms through the Golgi in the pancreatic beta-cell line, HIT-T15. Biochem Soc Trans. 2001;29:461–467. - PubMed
-
- Dauty E, Verkman AS. Molecular crowding reduces to a similar extent the diffusion of small solutes and macromolecules: measurement by fluorescence correlation spectroscopy. J. Mol. Recognit. 2004;17:441–447. - PubMed
-
- Zhou YL, Liao JM, Chen J, Liang Y. Macromolecular crowding enhances the binding of superoxide dismutase to xanthine oxidase: implications for protein-protein interactions in intracellular environments. Int J Biochem Cell Biol. 2006;38:1986–1994. - PubMed
Publication types
MeSH terms
Substances
Grants and funding
LinkOut - more resources
Full Text Sources
Miscellaneous

