

Reconstructing nonlinear dynamic models of gene regulation using stochastic sampling
- PMID: 20038296
- PMCID: PMC2811124
- DOI: 10.1186/1471-2105-10-448
Reconstructing nonlinear dynamic models of gene regulation using stochastic sampling
Abstract
Background: The reconstruction of gene regulatory networks from time series gene expression data is one of the most difficult problems in systems biology. This is due to several reasons, among them the combinatorial explosion of possible network topologies, limited information content of the experimental data with high levels of noise, and the complexity of gene regulation at the transcriptional, translational and post-translational levels. At the same time, quantitative, dynamic models, ideally with probability distributions over model topologies and parameters, are highly desirable.
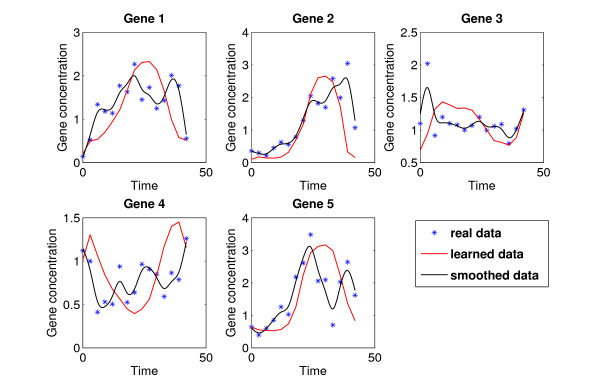
Results: We present a novel approach to infer such models from data, based on nonlinear differential equations, which we embed into a stochastic Bayesian framework. We thus address both the stochasticity of experimental data and the need for quantitative dynamic models. Furthermore, the Bayesian framework allows it to easily integrate prior knowledge into the inference process. Using stochastic sampling from the Bayes' posterior distribution, our approach can infer different likely network topologies and model parameters along with their respective probabilities from given data. We evaluate our approach on simulated data and the challenge #3 data from the DREAM 2 initiative. On the simulated data, we study effects of different levels of noise and dataset sizes. Results on real data show that the dynamics and main regulatory interactions are correctly reconstructed.
Conclusions: Our approach combines dynamic modeling using differential equations with a stochastic learning framework, thus bridging the gap between biophysical modeling and stochastic inference approaches. Results show that the method can reap the advantages of both worlds, and allows the reconstruction of biophysically accurate dynamic models from noisy data. In addition, the stochastic learning framework used permits the computation of probability distributions over models and model parameters, which holds interesting prospects for experimental design purposes.
Figures
Similar articles
-
Hub-centered gene network reconstruction using automatic relevance determination.PLoS One. 2012;7(5):e35077. doi: 10.1371/journal.pone.0035077. Epub 2012 May 3. PLoS One. 2012. PMID: 22570688 Free PMC article.
-
Identification of Gene Regulatory Networks Using Variational Bayesian Inference in the Presence of Missing Data.IEEE/ACM Trans Comput Biol Bioinform. 2023 Jan-Feb;20(1):399-409. doi: 10.1109/TCBB.2022.3144418. Epub 2023 Feb 3. IEEE/ACM Trans Comput Biol Bioinform. 2023. PMID: 35061589
-
MICRAT: a novel algorithm for inferring gene regulatory networks using time series gene expression data.BMC Syst Biol. 2018 Dec 14;12(Suppl 7):115. doi: 10.1186/s12918-018-0635-1. BMC Syst Biol. 2018. PMID: 30547796 Free PMC article.
-
Statistical Network Inference for Time-Varying Molecular Data with Dynamic Bayesian Networks.Methods Mol Biol. 2019;1883:25-48. doi: 10.1007/978-1-4939-8882-2_2. Methods Mol Biol. 2019. PMID: 30547395 Review.
-
Bayesian Computation Methods for Inferring Regulatory Network Models Using Biomedical Data.Adv Exp Med Biol. 2016;939:289-307. doi: 10.1007/978-981-10-1503-8_12. Adv Exp Med Biol. 2016. PMID: 27807752 Review.
Cited by
-
DREAM4: Combining genetic and dynamic information to identify biological networks and dynamical models.PLoS One. 2010 Oct 25;5(10):e13397. doi: 10.1371/journal.pone.0013397. PLoS One. 2010. PMID: 21049040 Free PMC article.
-
Learning interpretable network dynamics via universal neural symbolic regression.Nat Commun. 2025 Jul 6;16(1):6226. doi: 10.1038/s41467-025-61575-7. Nat Commun. 2025. PMID: 40617863 Free PMC article.
-
Integrated inference and analysis of regulatory networks from multi-level measurements.Methods Cell Biol. 2012;110:19-56. doi: 10.1016/B978-0-12-388403-9.00002-3. Methods Cell Biol. 2012. PMID: 22482944 Free PMC article. Review.
-
NoLiTiA: An Open-Source Toolbox for Non-linear Time Series Analysis.Front Neuroinform. 2022 Jun 24;16:876012. doi: 10.3389/fninf.2022.876012. eCollection 2022. Front Neuroinform. 2022. PMID: 35811996 Free PMC article.
-
Systems biology, emergence and antireductionism.Saudi J Biol Sci. 2016 Sep;23(5):584-91. doi: 10.1016/j.sjbs.2015.06.015. Epub 2015 Jun 27. Saudi J Biol Sci. 2016. PMID: 27579007 Free PMC article.
References
-
- Filkov V. In: Handbook of Computational Molecular Biology. Aluru S, editor. Boca Raton, FL, USA: Chapman & Hall/CRC Press; 2005. Identifying Gene Regulatory Networks from Gene Expression Data; pp. 27.1–27.29.
Publication types
MeSH terms
LinkOut - more resources
Full Text Sources
Miscellaneous
