. 2009 Dec 28;187(7):1071-82.
doi: 10.1083/jcb.200908075.

Opposite-polarity motors activate one another to trigger cargo transport in live cells

Affiliations

Opposite-polarity motors activate one another to trigger cargo transport in live cells

Shabeen Ally et al. J Cell Biol. .

Abstract

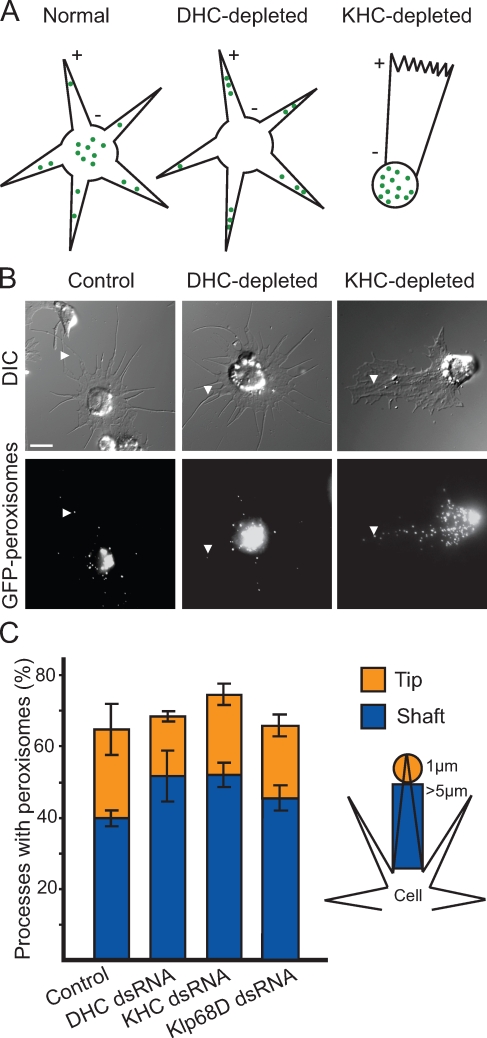
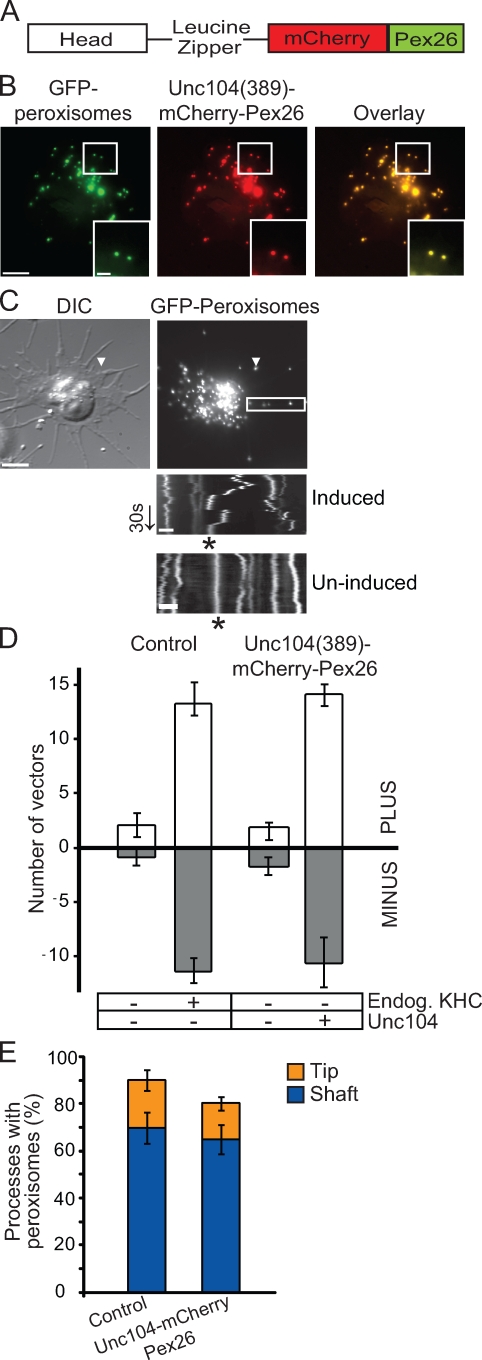
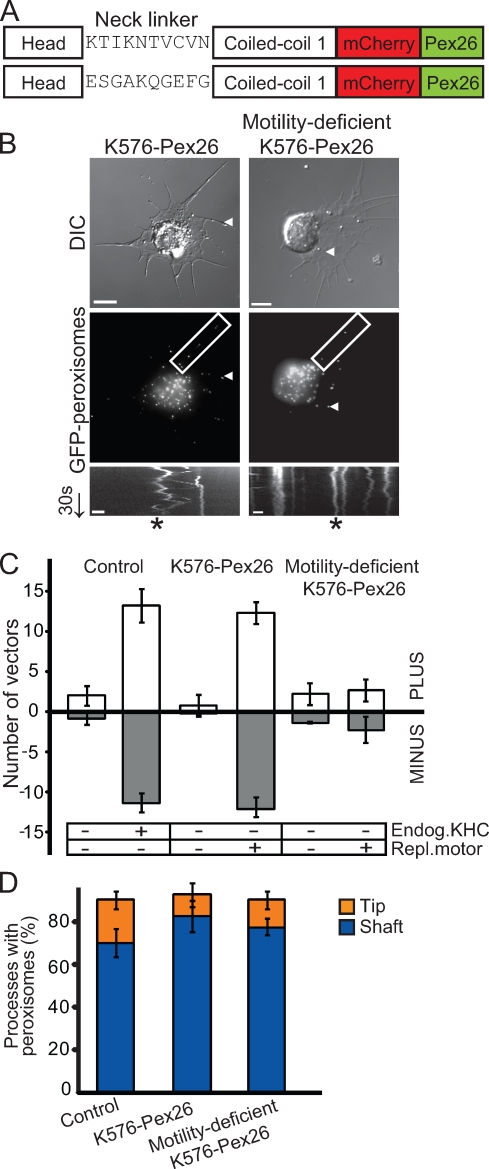
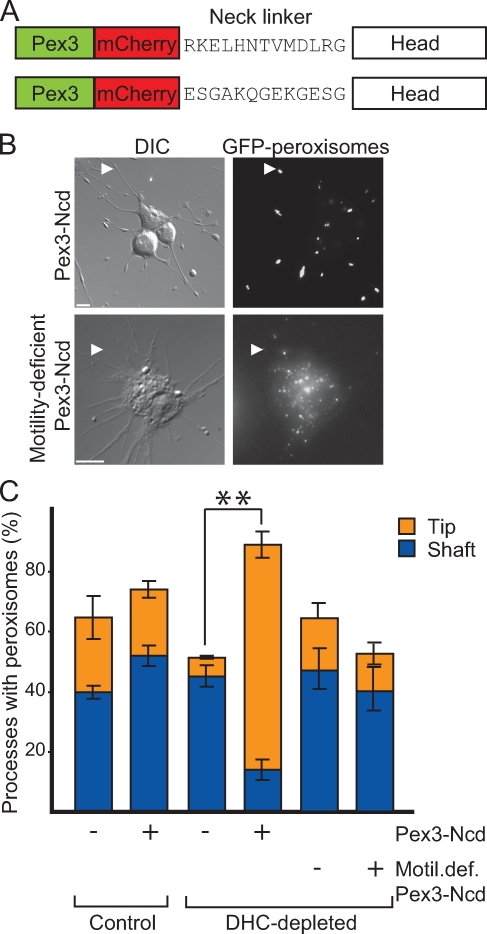
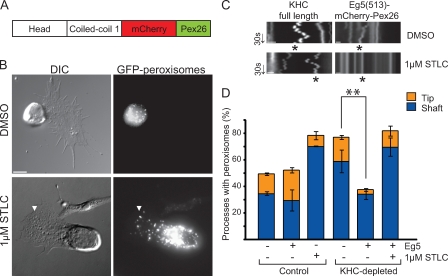
Intracellular transport is typically bidirectional, consisting of a series of back and forth movements. Kinesin-1 and cytoplasmic dynein require each other for bidirectional transport of intracellular cargo along microtubules; i.e., inhibition or depletion of kinesin-1 abolishes dynein-driven cargo transport and vice versa. Using Drosophila melanogaster S2 cells, we demonstrate that replacement of endogenous kinesin-1 or dynein with an unrelated, peroxisome-targeted motor of the same directionality activates peroxisome transport in the opposite direction. However, motility-deficient versions of motors, which retain the ability to bind microtubules and hydrolyze adenosine triphosphate, do not activate peroxisome motility. Thus, any pair of opposite-polarity motors, provided they move along microtubules, can activate one another. These results demonstrate that mechanical interactions between opposite-polarity motors are necessary and sufficient for bidirectional organelle transport in live cells.


Figures

Figure 1.
Figure 1.
Kinesin-1 and cytoplasmic dynein function in an interdependent manner during peroxisome transport in S2 cells. (A) Potential outcomes of RNAi-based motor depletion if motors work independently of each other. Schematic depicts S2 cells plated in the presence of 1 µM CytoD to induce formation of microtubule-filled processes. Microtubule polarity is indicated with + and − signs. Green dots represent GFP-labeled peroxisomes. (left) GFP-labeled peroxisomes are distributed in the cell body and along the length of processes. (middle) Plus end clusters are shown. DHC depletion allows kinesin-1 to transport GFP-labeled peroxisomes toward the tips of processes. (right) Minus end clusters are shown. KHC depletion allows dynein to transport GFP-labeled peroxisomes toward the cell center. Note that the altered morphology of KHC-depleted cells is discussed in Results. (B) Depletion of molecular motors does not alter peroxisome distribution along processes. Representative still images of S2 cells plated in the presence of CytoD on Con A–coated coverslips. (top) Differential interference contrast (DIC) images are shown. (bottom) Fluorescent images depicting GFP-labeled peroxisomes, corresponding to Videos 1–3. Arrowheads highlight the location of a single peroxisome within a process. Bar, 5 µm. (C) Bar graph representing the percentage of processes containing peroxisomes after RNAi-based depletion of motors (treatment with KHC, DHC, and Klp68D dsRNAs). Klp68D depletion served as a control. The total height of each column (blue and orange) represents the percentage of processes that contain peroxisomes anywhere along their length. The blue subcolumn represents the percentage of processes in which peroxisomes are limited to the shaft. The orange subcolumn represents the percentage of processes that contain at least one peroxisome at the tip. The schematic on the right identifies the parameters used to define shaft and tip (see Materials and methods). Data represent mean values ± SD from 120 cells per condition from three separate dsRNA treatments.
Figure 2.
Figure 2.
Unc104 replaces kinesin-1 in bidirectional peroxisome transport. (A) Schematic of Unc104(389)–mCherry-Pex26 construct. Dimeric human Unc104 construct includes the head and the neck-linker domains (amino acids 1–389) followed by a leucine zipper for dimerization. Human Pex26 is fused to mCherry to generate a peroxisome-targeting vector. (B) Representative images showing colocalization of Unc104(389)–mCherry-Pex26 and GFP-labeled peroxisomes in stably transfected S2 cells. Boxed areas are shown at higher magnifications in the insets. (C) Unc104(389)–mCherry-Pex26 restores bidirectional peroxisome motility in KHC-depleted cells. Unc104(389)–mCherry-Pex26 expression induced with 5 mM copper sulfate. Arrowheads highlight location of a single peroxisome within a process. Images corresponds to Video 4. Boxed area delineates the region selected for kymograph analysis (bottom). Top kymograph is from a cell in which Unc104(389)–mCherry-Pex26 expression has been induced. Bottom kymograph is from a cell in which Unc104(389)–mCherry-Pex26 expression has not been induced. Endogenous KHC has been depleted in both cases. Asterisks indicate the track of a peroxisome. DIC, differential interference contrast. Arrow delineates time (30 s). (D) Graph showing the number of peroxisome vectors >0.2 µm in S2 cells expressing Unc104(389)–mCherry-Pex26 in an endogenous KHC-depleted background. Data represent mean values ± SD from 30 cells per condition (from three separate dsRNA treatments). PLUS refers to those peroxisomes moving toward the tips of processes, whereas MINUS refers to those moving toward the cell center. (E) Replacement of endogenous KHC with Unc104(389)–mCherry-Pex26 does not affect peroxisome distribution along processes. Graph representing the percentage of processes containing peroxisomes after induction of Unc104(389)–mCherry-Pex26 in a KHC-depleted background. Data are presented as mean values ± SD from 120 cells (from three separate dsRNA treatments). Bars: (B and C [top]) 5 µm; (C [bottom]) 1 µm.
Figure 3.
Figure 3.
Plus end–directed movement activates dynein-driven transport. (A) Schematic of K576–mCherry-Pex26 constructs. Dimeric Drosophila KHC includes amino acids 1–576 (head and first coiled-coil domains) cloned into the mCherry-Pex26 peroxisome–targeting vector. (top) K576–mCherry-Pex26 with wild-type neck linker. (bottom) Motility-deficient K576ran10–mCherry-Pex26 with mutated neck linker (Case et al., 2000). (B) K576–mCherry-Pex26 recues bidirectional peroxisome motility in KHC-depleted cells, but a motility-deficient version does not. (top) Representative micrographs of S2 cells plated in the presence of CytoD and stably transfected with either K576–mCherry-Pex26 (left) or motility-deficient K576ran10–mCherry-Pex26 (right) in endogenous KHC-depleted backgrounds. Boxed areas delineate regions selected for kymograph analysis (bottom). Arrowheads highlight location of a single peroxisome within a process. Arrow delineates time (30 s). DIC, differential interference contrast. Bars, 5 µm. (bottom) Kymographs showing peroxisome tracks over 1 min. Asterisks indicate the track of a single peroxisome. Bars, 1 µm. Video 5 corresponds to peroxisome motility in K576–mCherry-Pex26–expressing cells. (C) Graph showing the relative number of peroxisome vectors >0.2 µm in S2 cells expressing K576–mCherry-Pex26 in an endogenous KHC-depleted background. Data represent mean values ± SD from 30 cells per condition (from three separate dsRNA treatments). PLUS refers to those peroxisomes moving toward the tips of processes, whereas MINUS refers to those moving toward the cell center. (D) Motility-deficient K576ran10–mCherry-Pex26 does not rescue dynein-driven peroxisome motility toward the minus ends of microtubules. Graph represents the percentage of processes containing peroxisomes after induction of replacement motors in KHC-depleted backgrounds. Data represent mean values ± SD from 120 cells (from three separate dsRNA treatments).
Figure 4.
Figure 4.
Ncd restores kinesin-1–driven transport. (A) Schematic of Pex3-mCherry–Ncd(700) constructs. Drosophila Pex3 is fused to mCherry and human Ncd encoded by amino acids 201–700. (top) Pex3-mCherry–Ncd(700) with wild-type neck linker. (bottom) Motility-deficient Pex3-mCherry–Ncd(700)ran12 with mutated neck linker (Sablin et al.,1998). (B) Pex3-mCherry–Ncd(700) expression results in accumulation of peroxisomes at the tips of processes. S2 cells stably transfected and plated in the presence of CytoD in an endogenous DHC-depleted background. DIC, differential interference contrast. Arrowheads highlight peroxisomes in processes. Bars, 5 µm. (C) Quantitative representation of results showing changes in the distribution of peroxisomes along processes before and after DHC depletion and expression of Pex3-mCherry–Ncd. Data represent mean values ± SD from 120 cells per condition from three separate dsRNA treatments. Asterisks indicate statistical significance using the Student’s t test.
Figure 5.
Figure 5.
Eg5 restores dynein-driven transport. (A) Schematic of Eg5(513)–mCherry-Pex26. Dimeric Xenopus Eg5 encodes the head, neck-linker, and first coiled-coil domains (amino acids 1–513). Dimeric Eg5 was cloned into the mCherry-Pex26 peroxisome-targeting vector. (B) Eg5(513)–mCherry-Pex26 expression results in peroxisome clustering at the cell center. S2 cells plated in the presence of CytoD and stably transfected with Eg5(513)–mCherry-Pex26 in an endogenous KHC-depleted background. (bottom) Plated in the presence of 1 µM STLC for 2 h. Arrowheads highlight location of a single peroxisome within a process. DIC, differential interference contrast. (C) Kymographs of GFP-labeled peroxisomes present along the length of a single process. Kymographs were derived from S2 cells expressing either full-length KHC (left) or Eg5(513)–mCherry-Pex26 (right) in an endogenous KHC-depleted background. Cells were plated in the presence of either DMSO (top) or 1 µM STLC (bottom). Asterisk indicates the track of a single peroxisome over the course of 1 min. Arrows delineate time (30 s). (D) Quantitative representation of results showing changes in the distribution of peroxisomes along processes before and after KHC depletion and expression of Eg5(513)–mCherry-Pex26. Data represent mean values ± SD from 120 cells per condition (from three separate dsRNA treatments). Asterisks indicate statistical significance using the Student’s t test. Bars: (B) 5 µm; (C) 1 µm.

Similar articles

Cited by

References

    1. Barkus R.V., Klyachko O., Horiuchi D., Dickson B.J., Saxton W.M. 2008. Identification of an axonal kinesin-3 motor for fast anterograde vesicle transport that facilitates retrograde transport of neuropeptides. Mol. Biol. Cell. 19:274–283 10.1091/mbc.E07-03-0261 - DOI - PMC - PubMed
    1. Block S.M., Asbury C.L., Shaevitz J.W., Lang M.J. 2003. Probing the kinesin reaction cycle with a 2D optical force clamp. Proc. Natl. Acad. Sci. USA. 100:2351–2356 10.1073/pnas.0436709100 - DOI - PMC - PubMed
    1. Brier S., Lemaire D., DeBonis S., Forest E., Kozielski F. 2006. Molecular dissection of the inhibitor binding pocket of mitotic kinesin Eg5 reveals mutants that confer resistance to antimitotic agents. J. Mol. Biol. 360:360–376 10.1016/j.jmb.2006.04.062 - DOI - PubMed
    1. Case R.B., Rice S., Hart C.L., Ly B., Vale R.D. 2000. Role of the kinesin neck linker and catalytic core in microtubule-based motility. Curr. Biol. 10:157–160 10.1016/S0960-9822(00)00316-X - DOI - PubMed
    1. Caviston J.P., Holzbaur E.L. 2009. Huntingtin as an essential integrator of intracellular vesicular trafficking. Trends Cell Biol. 19:147–155 - PMC - PubMed

Publication types

MeSH terms