

Development of a common oligonucleotide reference standard for microarray data normalization and comparison across different microbial communities
- PMID: 20038701
- PMCID: PMC2820949
- DOI: 10.1128/AEM.02749-09
Development of a common oligonucleotide reference standard for microarray data normalization and comparison across different microbial communities
Abstract
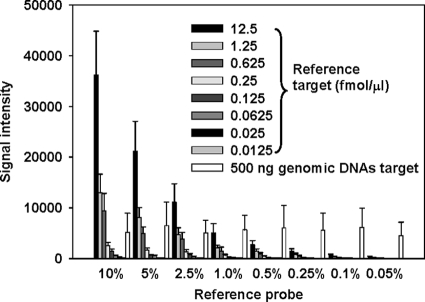
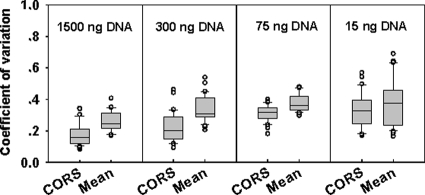
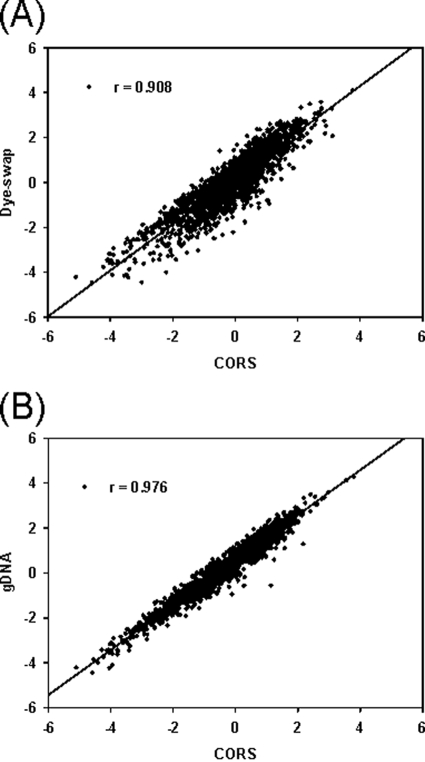
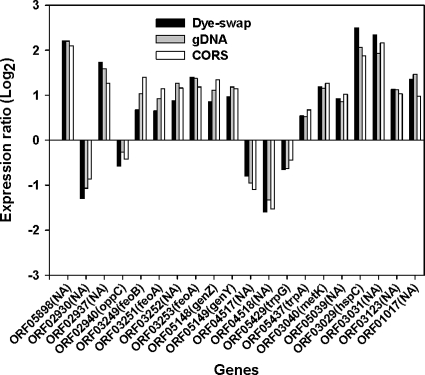
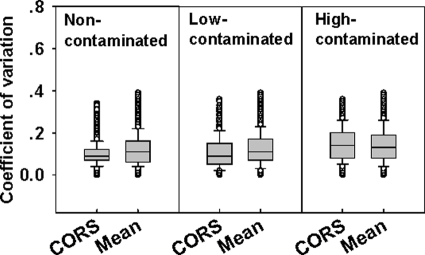
High-density functional gene arrays have become a powerful tool for environmental microbial detection and characterization. However, microarray data normalization and comparison for this type of microarray remain a challenge in environmental microbiology studies because some commonly used normalization methods (e.g., genomic DNA) for the study of pure cultures are not applicable. In this study, we developed a common oligonucleotide reference standard (CORS) method to address this problem. A unique 50-mer reference oligonucleotide probe was selected to co-spot with gene probes for each array feature. The complementary sequence was synthesized and labeled for use as the reference target, which was then spiked and cohybridized with each sample. The signal intensity of this reference target was used for microarray data normalization and comparison. The optimal amount or concentration were determined to be ca. 0.5 to 2.5% of a gene probe for the reference probe and ca. 0.25 to 1.25 fmol/microl for the reference target based on our evaluation with a pilot array. The CORS method was then compared to dye swap and genomic DNA normalization methods using the Desulfovibrio vulgaris whole-genome microarray, and significant linear correlations were observed. This method was then applied to a functional gene array to analyze soil microbial communities, and the results demonstrated that the variation of signal intensities among replicates based on the CORS method was significantly lower than the total intensity normalization method. The developed CORS provides a useful approach for microarray data normalization and comparison for studies of complex microbial communities.
Figures
Similar articles
-
GeoChip 3.0 as a high-throughput tool for analyzing microbial community composition, structure and functional activity.ISME J. 2010 Sep;4(9):1167-79. doi: 10.1038/ismej.2010.46. Epub 2010 Apr 29. ISME J. 2010. PMID: 20428223
-
A new non-linear normalization method for reducing variability in DNA microarray experiments.Genome Biol. 2002 Aug 30;3(9):research0048. doi: 10.1186/gb-2002-3-9-research0048. Epub 2002 Aug 30. Genome Biol. 2002. PMID: 12225587 Free PMC article.
-
Utilization of a labeled tracking oligonucleotide for visualization and quality control of spotted 70-mer arrays.BMC Genomics. 2004 Feb 9;5(1):12. doi: 10.1186/1471-2164-5-12. BMC Genomics. 2004. PMID: 15018646 Free PMC article.
-
Homogeneous versus heterogeneous probes for microbial ecological microarrays.Trends Biotechnol. 2006 Jul;24(7):318-23. doi: 10.1016/j.tibtech.2006.04.010. Epub 2006 May 12. Trends Biotechnol. 2006. PMID: 16697477 Review.
-
Normalization of microarray data: single-labeled and dual-labeled arrays.Mol Cells. 2006 Dec 31;22(3):254-61. Mol Cells. 2006. PMID: 17202852 Review.
Cited by
-
Improvement of cellulose catabolism in Clostridium cellulolyticum by sporulation abolishment and carbon alleviation.Biotechnol Biofuels. 2014 Feb 20;7(1):25. doi: 10.1186/1754-6834-7-25. Biotechnol Biofuels. 2014. PMID: 24555718 Free PMC article.
-
Development of HuMiChip for functional profiling of human microbiomes.PLoS One. 2014 Mar 4;9(3):e90546. doi: 10.1371/journal.pone.0090546. eCollection 2014. PLoS One. 2014. PMID: 24595026 Free PMC article.
-
Use of functional gene arrays for elucidating in situ biodegradation.Front Microbiol. 2012 Sep 21;3:339. doi: 10.3389/fmicb.2012.00339. eCollection 2012. Front Microbiol. 2012. PMID: 23049526 Free PMC article.
-
Microbial communities and functional genes associated with soil arsenic contamination and the rhizosphere of the arsenic-hyperaccumulating plant Pteris vittata L.Appl Environ Microbiol. 2010 Nov;76(21):7277-84. doi: 10.1128/AEM.00500-10. Epub 2010 Sep 10. Appl Environ Microbiol. 2010. PMID: 20833780 Free PMC article.
-
Coexistence patterns of soil methanogens are closely tied to methane generation and community assembly in rice paddies.Microbiome. 2021 Jan 22;9(1):20. doi: 10.1186/s40168-020-00978-8. Microbiome. 2021. PMID: 33482926 Free PMC article.
References
-
- Andersen, M., and C. Foy. 2005. The development of microarray standards. Anal. Bioanal. Chem. 381:87-89. - PubMed
Publication types
MeSH terms
Substances
LinkOut - more resources
Full Text Sources
Other Literature Sources
Miscellaneous
