

Relative plasma volume monitoring during hemodialysis AIDS the assessment of dry weight
- PMID: 20038754
- PMCID: PMC2819307
- DOI: 10.1161/HYPERTENSIONAHA.109.143974
Relative plasma volume monitoring during hemodialysis AIDS the assessment of dry weight
Abstract
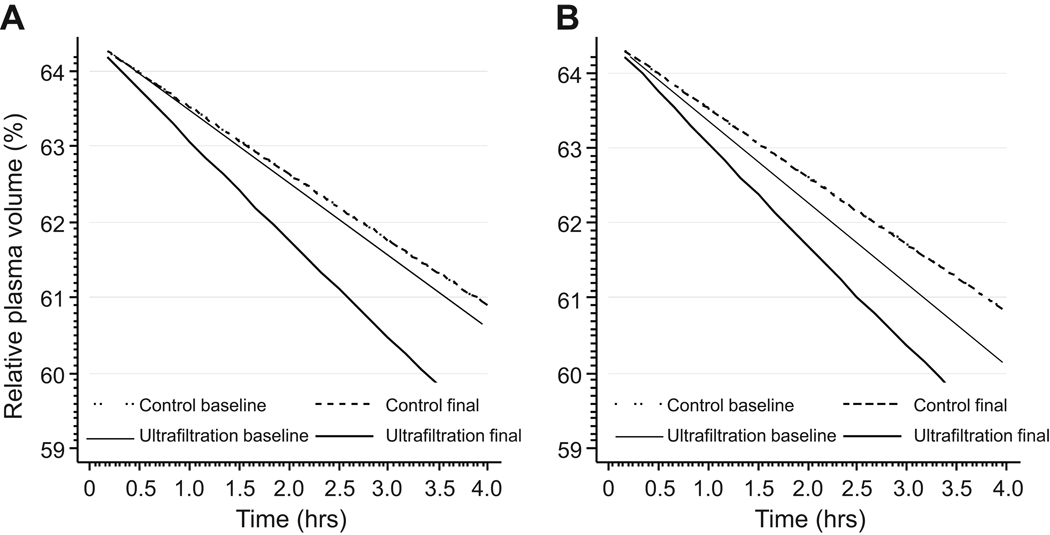
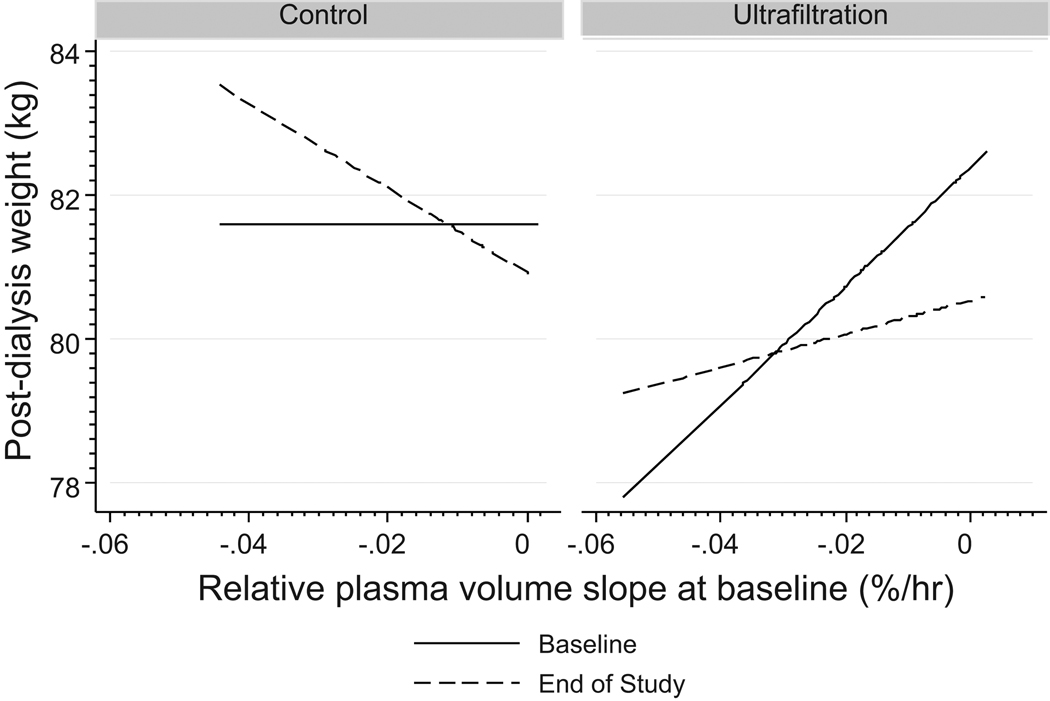
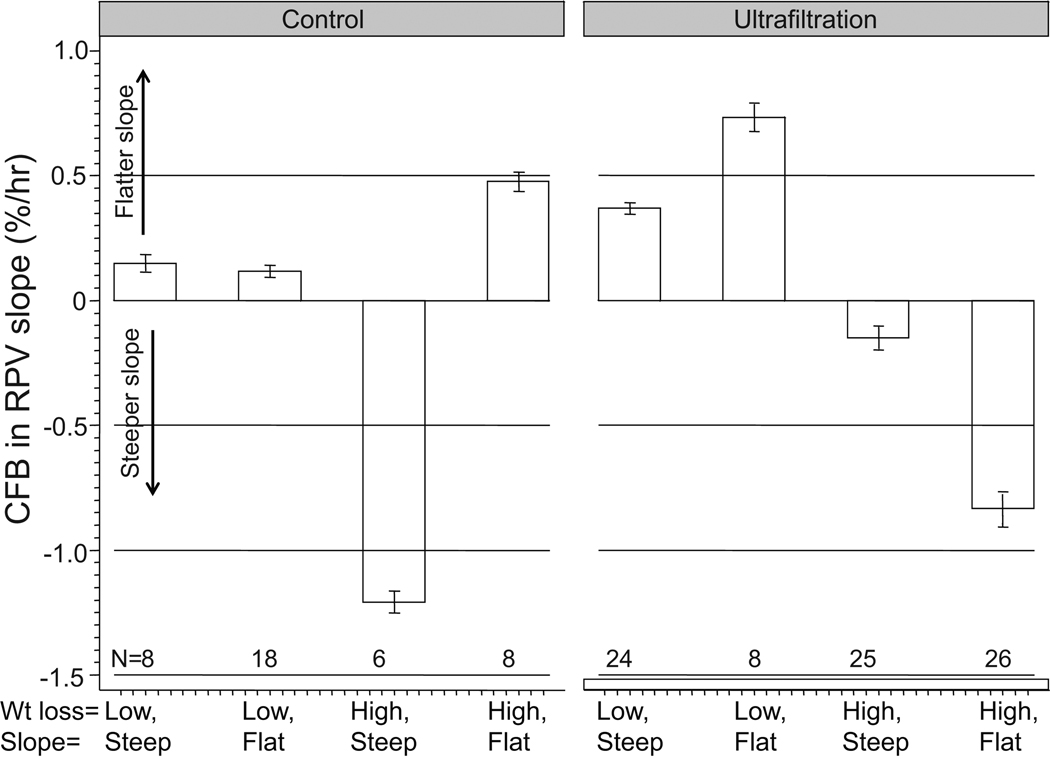
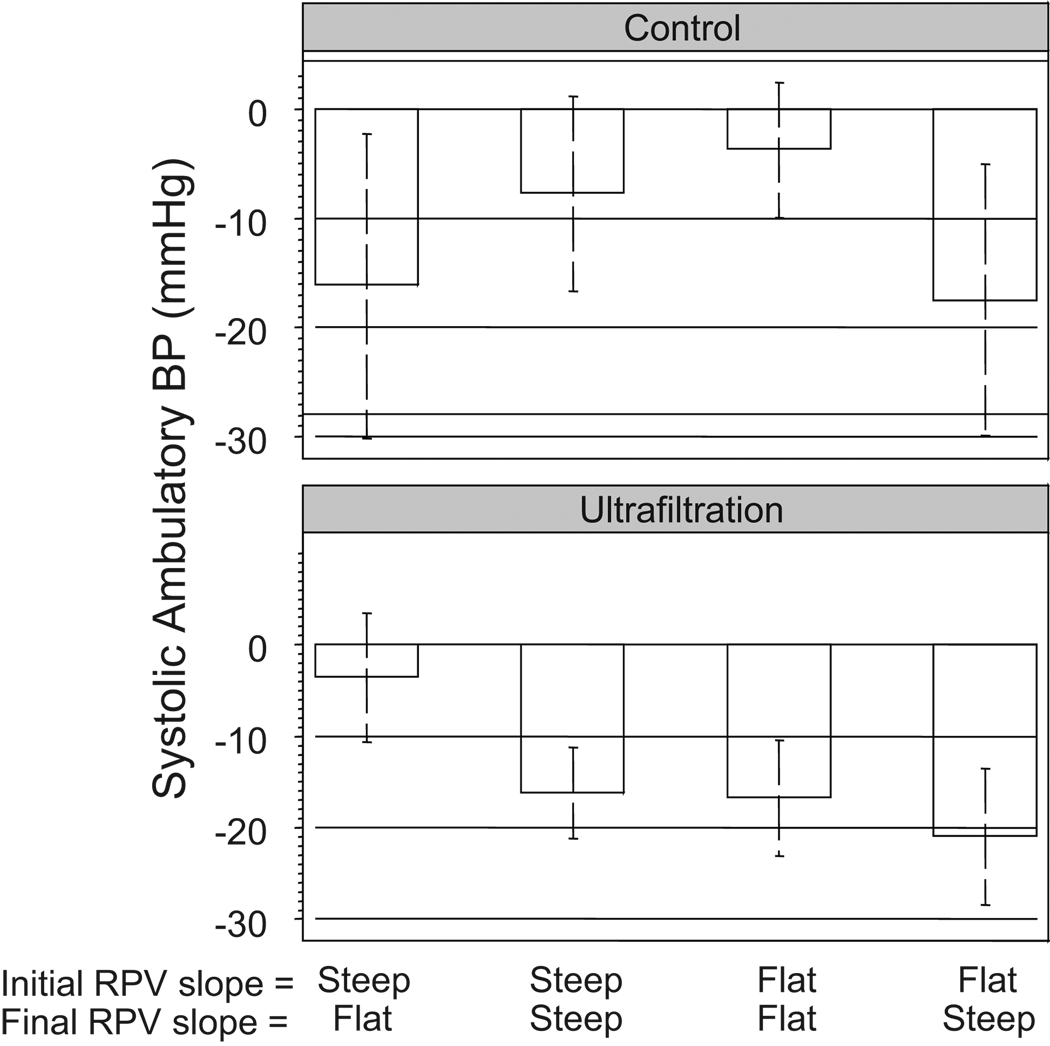
Among hemodialysis patients, the assessment of dry weight remains a matter of clinical judgment because tests to assess dry weight have not been validated. The objective of this study was to evaluate and validate relative plasma volume (RPV) monitoring as a marker of dry weight. We performed RPV monitoring using the Crit-Line monitor at baseline and at 8 weeks in 150 patients participating in the Dry-Weight Reduction in Hypertensive Hemodialysis Patients Trial. The intervention group of 100 patients had dry weight probed, whereas 50 patients served as time controls. RPV slopes were defined as flat when they were less than the median (1.33% per hour) at the baseline visit. Among predominantly (87%) black hemodialysis patients, we found that flat RPV slopes suggest a volume-overloaded state for the following reasons: (1) probing dry weight in these patients led to steeper slopes; (2) those with flatter slopes at baseline had greater weight loss; (3) both baseline RPV slopes and the intensity of weight loss were found to be important for subsequent change in RPV slopes; and, most importantly, (4) RPV slopes predicted the subsequent reduction in interdialytic ambulatory systolic blood pressure. Those with the flattest slopes had the greatest decline in blood pressure on probing dry weight. Both baseline RPV slopes and the change in RPV slopes were important for subsequent changes in ambulatory systolic blood pressure. We conclude that RPV slope monitoring is a valid method to assess dry weight among hypertensive hemodialysis patients.
Trial registration: ClinicalTrials.gov NCT00067665.
Figures
Comment in
-
Relative plasma volume monitoring and blood pressure control: an overlooked opportunity to achieve dry weight in the hemodialysis patient.Hypertension. 2010 Feb;55(2):226-7. doi: 10.1161/HYPERTENSIONAHA.109.146084. Epub 2009 Dec 28. Hypertension. 2010. PMID: 20038745 No abstract available.
Similar articles
-
Dry-weight: a concept revisited in an effort to avoid medication-directed approaches for blood pressure control in hemodialysis patients.Clin J Am Soc Nephrol. 2010 Jul;5(7):1255-60. doi: 10.2215/CJN.01760210. Epub 2010 May 27. Clin J Am Soc Nephrol. 2010. PMID: 20507951 Free PMC article. Review.
-
Determinants and short-term reproducibility of relative plasma volume slopes during hemodialysis.Clin J Am Soc Nephrol. 2012 Dec;7(12):1996-2001. doi: 10.2215/CJN.04190412. Epub 2012 Sep 20. Clin J Am Soc Nephrol. 2012. PMID: 22997342 Free PMC article.
-
Home blood pressure measurements for managing hypertension in hemodialysis patients.Am J Nephrol. 2009;30(2):126-34. doi: 10.1159/000206698. Epub 2009 Feb 27. Am J Nephrol. 2009. PMID: 19246891 Free PMC article.
-
Hypervolemia is associated with increased mortality among hemodialysis patients.Hypertension. 2010 Sep;56(3):512-7. doi: 10.1161/HYPERTENSIONAHA.110.154815. Epub 2010 Jul 12. Hypertension. 2010. PMID: 20625076 Free PMC article.
-
Systolic and diastolic hypertension among patients on hemodialysis: Musings on volume overload, arterial stiffness, and erythropoietin.Semin Dial. 2019 Nov;32(6):507-512. doi: 10.1111/sdi.12837. Epub 2019 Aug 28. Semin Dial. 2019. PMID: 31463996 Free PMC article. Review.
Cited by
-
B-type natriuretic peptide is not a volume marker among patients on hemodialysis.Nephrol Dial Transplant. 2013 Dec;28(12):3082-9. doi: 10.1093/ndt/gft054. Epub 2013 Mar 22. Nephrol Dial Transplant. 2013. PMID: 23525529 Free PMC article. Clinical Trial.
-
Dry-weight: a concept revisited in an effort to avoid medication-directed approaches for blood pressure control in hemodialysis patients.Clin J Am Soc Nephrol. 2010 Jul;5(7):1255-60. doi: 10.2215/CJN.01760210. Epub 2010 May 27. Clin J Am Soc Nephrol. 2010. PMID: 20507951 Free PMC article. Review.
-
Assessing Extracellular Volume in Hemodialysis Patients Using Intradialytic Blood Pressure Slopes.Nephron. 2018;139(2):120-130. doi: 10.1159/000487093. Epub 2018 Feb 13. Nephron. 2018. PMID: 29439257 Free PMC article.
-
Body Fluids in End-Stage Renal Disease: Statics and Dynamics.Blood Purif. 2019;47(1-3):223-229. doi: 10.1159/000494583. Epub 2018 Dec 5. Blood Purif. 2019. PMID: 30517920 Free PMC article. Review.
-
Setting the dry weight and its cardiovascular implications.Semin Dial. 2017 Nov;30(6):481-488. doi: 10.1111/sdi.12624. Epub 2017 Jun 30. Semin Dial. 2017. PMID: 28666069 Free PMC article. Review.
References
-
- Ishibe S, Peixoto AJ. Methods of assessment of volume status and intercompartmental fluid shifts in hemodialysis patients: implications in clinical practice. Semin Dial. 2004;17:37–43. - PubMed
-
- Thomson GE, Waterhouse K, McDonald HP, Jr, Friedman EA. Hemodialysis for chronic renal failure. Clinical observations. Arch Intern Med. 1967;120:153–167. - PubMed
-
- Khosla UM, Johnson RJ. Hypertension in the hemodialysis patient and the "lag phenomenon": insights into pathophysiology and clinical management. Am J Kidney Dis. 2004;43:739–751. - PubMed
Publication types
MeSH terms
Associated data
Grants and funding
LinkOut - more resources
Full Text Sources
Other Literature Sources
Medical
