. 2010 Jan;120(1):223-41.
doi: 10.1172/JCI38012. Epub 2009 Dec 14.

Genetic and epigenetic silencing of SCARA5 may contribute to human hepatocellular carcinoma by activating FAK signaling

Affiliations

Genetic and epigenetic silencing of SCARA5 may contribute to human hepatocellular carcinoma by activating FAK signaling

Jian Huang et al. J Clin Invest. 2010 Jan.

Abstract

The epigenetic silencing of tumor suppressor genes is a crucial event during carcinogenesis and metastasis. Here, in a human genome-wide survey, we identified scavenger receptor class A, member 5 (SCARA5) as a candidate tumor suppressor gene located on chromosome 8p. We found that SCARA5 expression was frequently downregulated as a result of promoter hypermethylation and allelic imbalance and was associated with vascular invasion in human hepatocellular carcinoma (HCC). Furthermore, SCARA5 knockdown via RNAi markedly enhanced HCC cell growth in vitro, colony formation in soft agar, and invasiveness, tumorigenicity, and lung metastasis in vivo. By contrast, SCARA5 overexpression suppressed these malignant behaviors. Interestingly, SCARA5 was found to physically associate with focal adhesion kinase (FAK) and inhibit the tyrosine phosphorylation cascade of the FAK-Src-Cas signaling pathway. Conversely, silencing SCARA5 stimulated the signaling pathway via increased phosphorylation of certain tyrosine residues of FAK, Src, and p130Cas; it was also associated with activation of MMP9, a tumor metastasis-associated enzyme. Taken together, these data suggest that the plasma membrane protein SCARA5 can contribute to HCC tumorigenesis and metastasis via activation of the FAK signaling pathway.


Figures
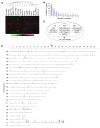
Figure 1
Figure 1. Gene expression profiling by demethylation treatment.
(A) Gene expression profiles of the 15 HCC cell lines that received treatment with or without DAC plus TSA were analyzed using an Agilent gene microarray. Clustering was performed with GeneSpring 7.5 software. Hierarchical clustering revealed 524 transcripts with marked upregulation, defined as an increase of more than 3 fold relative to those before treatment, in at least 3 cell lines, following drug treatment. (B) Distribution of the number of cell lines, showing marked upregulation (more than 3 fold) of the 524 genes after drug treatment. (C) Venn diagram of the distribution of the 524 upregulated genes, based on whether they do or do not possess CpG islands. (D) Chromosomal (chro) location of the 524 candidate genes. The vertical bars indicate the percentage of reexpression of the 524 upregulated genes following demethylation treatment in the 15 cell lines.
Figure 2
Figure 2. Genomic structure and methylation status of SCARA5 on chromosome 8p.
(A) Hierarchical clustering shows 9 genes located on chromosome 8p that were markedly upregulated more than 3 fold, in at least 3 cell lines following drug treatment. (B) The reexpression of the SCARA5 gene on 8p was evaluated by RT-PCR in the HCC cell lines treated with no drug, DAC, TSA, or DAC plus TSA. β-actin was used as a loading control. (C) Schematic representations of the location of CpG islands within the promoter and intragenic regions of SCARA5 and of the primers designed against the promoter region for PCR amplification. PCR fragments were amplified from the bisulfite-treated DNA from the HCC cell lines and specimens used as templates. The numbers in parentheses indicate the distance from these CpG islands within promoter (CG1) and intragenic regions (CG2 and CG3) to the SCARA5 transcription start sites in base pairs, and the corresponding numbers indicate the length of these CpG islands. (D) Representative results from the sequencing bisulfite-treated genomic DNA to detect the methylation level of the CG1 region in Bel-7404, Bel-7405, YY-8103, SMMC-7721, QGY-7701, and QGY-7703 cells after treatment with DAC, compared with the methylation level in control cells (P < 0.05). The numbers indicate the CG dinucleotide within the CpG island in the promoter.
Figure 3
Figure 3. Expression pattern of SCARA5 in HCC.
(A) Endogenous SCARA5 (red) in PLC/PRF/5 cells was detected by immunofluorescence. Original magnification, ×1,000. (B) Schematic diagram of the SCARA5 membrane protein, consisting of multiple functional domains. (C) Real time RT-PCR analysis of SCARA5 was carried out on 40 paired HCC samples and adjacent noncancerous tissue. For each sample, the relative SCARA5 mRNA level was normalized to that of β-actin. The vertical line within each box represents the median –ΔCt value. The upper and lower edges of each box represent the 75th and 25th percentile, respectively. The upper and lower horizontal bars indicate the highest and lowest values determined, respectively. (D) Representative immunohistochemical staining of a pair of HCC specimens and corresponding noncancerous tissue, using the anti-SCARA5 antibody on a tissue array containing 78 pairs of HCC specimens. The nuclei were counterstained with hematoxylin. Original magnification, ×40 (left); ×400 (right). (E) Statistical analysis was performed using the GraphPad Prism 5 program to compare the relative levels of SCARA5 in HCC with PVTT with cells without PVTT (P = 0.02169, Mann-Whitney Test). Black triangles indicate the HCC sample, and the transverse lines indicate the mean.
Figure 4
Figure 4. LOH analysis of the SCARA5 locus in HCC samples.
(A) Schematic representation of the microsatellite markers D8S1839, D8S1820, and D8S1809 located on chromosome 8p21.1; these markers flank the SCARA5 locus. The BAC clone RP11-597M17 spanning the SCARA5 locus was used as a probe in the FISH assay. (B) The markers were used to analyze LOH in 40 pairs of HCC samples. The figure shows representative results of LOH from 1 pair of primary HCC tissues and the corresponding adjacent noncancerous tissue. The arrows indicate the heterozygous allelic loss in the tumor DNA. (C) HCC tissue samples were analyzed by FISH using the BAC clones RP11-597M17 (red) and CEP8 (green) for the centromere of chromosome 8 as probes. Typical FISH results are shown for the CEP8 (green) and SCARA5 (red) probes, while the genomic structure of chromosome 8p and the probe positions are illustrated in A. C29, case 29. Original magnification, ×1,000. (D) Correlation between mRNA levels and the corresponding methylation level of the SCARA5 promoter in 14 primary HCC samples with LOH (mean ± SD). + indicates an increase in SCARA5 promoter methylation.
Figure 5
Figure 5. The effect of SCARA5 on cell growth, colony formation, and tumorigenicity.
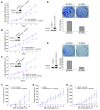
(AC) Exogenous SCARA5 was expressed in Huh7 (A), Hep3B (B), and MHCC-H (C) cells transfected with the pcDNA3.1 vector. Parental cells with empty vector were used as a control. The growth of these cells was analyzed using the CCK-8 kit. The experiments were repeated at least 3 times, and the symbols represent the mean values of triplicate tests (mean ± SD). Western blot analysis in the insets indicated the expressed SCARA5 in these cell lines. A t test was used to show significant differences between 2 groups (P < 0.05). (D and E) To observe the effect of SCARA5 on colony formation, pcDNA3.1-SCARA5 was transfected into Huh7 (D) and Hep3B (E) cells, and SCARA5 overexpression was confirmed by immunoblotting. After transfection for 24 hours, the cells were scraped and plated on dishes and cultured in G418 for 3 weeks. The representative dishes show the inhibitory effect of SCARA5 on colony formation. The lower histogram shows that colony formation was significantly suppressed by SCARA5, compared with the vector-only control (P < 0.01), where the numbers are the mean value of 3 independent experiments with SD. (FH) Increased exogenous SCARA5 expression inhibits xenograft tumor growth of Huh7 (F), Hep3B (G), and MHCC-H (H) cells infected with a recombinant adenovirus carrying SCARA5. These cells were injected subcutaneously into nude mice, while the cells carrying empty vector or parental cells were used as controls. Tumor growth was monitored for 3 days by measuring the tumor diameters (mean ± SD).
Figure 6
Figure 6. Effect of SCARA5 silencing on cell growth, colony formation, and tumorigenicity of HCC cells.
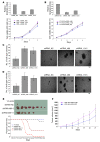
(A and B) Both siRNA-489 and siRNA-1515 were used to knockdown SCARA5 in WRL-68 (A) and YY-8103 (B) cells, as demonstrated by real time RT-PCR, where siRNA-NC was used as control. Cell growth was measured, and each symbol represents a mean value of triplicate experiments (mean ± SD). (C and D) To observe the effect of SCARA5 silencing on colony formation in soft agar, pSUPER containing shRNA-489 and shRNA-1515 was transfected into WRL-68 (C) and YY-8103 (D) cells, respectively. Representative results show the increase in anchorage-independent colony formation. The numbers of colonies in the histogram represent the mean of 3 independent experiments (mean ± SD) (P < 0.01, compared with control). Original magnification, ×40. (E) Two stable SCARA5 knockdown subclones (shRNA-489-2 and shRNA-489-11) from YY-8103 cells were injected subcutaneously into mice; each group contained 8 mice. YY-8103 cells with either empty vectors or shRNA-NC were used as controls. A Kaplan-Meier survival plot 8 weeks after injection indicates that the mice injected with the shRNA-489 cells survived for a significantly shorter period of time than the controls (P < 0.001). All xenograft tumors were removed from the experimental mice (upper panel). (F) Silencing of SCARA5 enhances the tumorigenicity of WRL-68 cells with shRNA-489. The cells transfected with shRNA-NC were used as a negative control. Tumor growth was monitored for 4 days by measuring the diameter (mean ± SD).
Figure 7
Figure 7. SCARA5 modulates HCC cell migration, invasion, and metastasis.
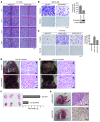
(A) The migration of YY-8103 cells transfected with shRNA-489 in wound-healing experiment. (B) Cell invasion of MHCC-M3 cells infected with an adenovirus vector containing SCARA5 was evaluated with Matrigel assay. (C) The same approach was used for 2 stable YY-8103 subclones (shRNA-489-2 and shRNA-489-11) with SCARA5 knockdown. Counts of trespassed cells represent mean values per field (from at least 5 fields) from 3 independent experiments (right) (mean ± SD). (DF) Effect of SCARA5 overexpression on liver metastasis of MHCC-LM3 cells with adenovirus-SCARA5, from spleen through the portal vein. No metastatic nodules were found in livers of any of SCID mice (n = 8) at 2 weeks after injection (D), but a small metastatic nodule formed at 4 weeks (n = 3). (E). However, cells with empty vector formed metastatic nodules (n = 6) at 2 weeks and larger ones at 4 weeks (n = 3). Representative images show livers and H&E-stained sections. (F) Tumors were weighed at 4 weeks; the weight is indicated (mean ± SD). (G) Representative images of metastases that formed in lungs of each nude mouse (n = 7) at 16 weeks after tail vein injection of YY-8103 cells with shRNA-489-2 or shRNA-NC. The sections show the lung tissues of mice injected with these cells. N, normal lung; M, metastatic nodule. White and black arrows indicate metastatic tumors in liver and lung, respectively. Original magnification, ×100 (AC); ×400 (D and E, right panels); ×200 (G, right panels).
Figure 8
Figure 8. SCARA5 physically associates with FAK and modulates the tyrosine phosphorylation of FAK, Src, and p130Cas.
(A) Colocalization of both SCARA5 (red) and FAK (green) in PLC/PRF/5 cells by immunofluorescence. The bottom right panel is enlarged from the boxed region of the bottom left image. Original magnification, ×1,000 (top row and bottom left panel); ×5,000 (bottom right panel). (B and C) Co-IP assays were performed in MHCC-LM3 cells transiently transfected with a pcDNA3.1 vector containing myc-tagged SCARA5. The cells transfected with empty vector were used as a control. Endogenous FAK was immunoprecipitated with the anti-myc antibody (B), while the myc-tagged SCARA5 was reciprocally immunoprecipitated using the anti-FAK antibody (C). Native mouse IgG was used as the negative control, and 5% of the total MHCC-LM3 cell lysate was used for input. (D) Overexpression of SCARA5 inhibits the tyrosine phosphorylation of FAK (Tyr-397), Src (Tyr-416), and p130Cas (Tyr-165) in MHCC-LM3 cells. SCARA5 knockdown by shRNA promotes phosphorylation in YY-8103 cells. The total levels of these proteins were assessed by immunoblotting with the corresponding antibodies. β-actin was used as a loading control. Quantification of FAK, Src, and p130Cas phosphorylation levels, as indicated by the numbers above the corresponding panels, was performed by normalizing the total FAK, Src, and p130Cas concentrations to the β-actin loading control. The activity of 2 MMPs, MMP-2 and MMP-9, was determined by the gelatin-based zymography assay. SCARA5 overexpression inhibits the activity of MMP-9 but not MMP-2 in MHCC-LM3 cells. SCARA5 knockdown by shRNA promotes the activity of MMP-9 in YY-8103 cells.
Figure 9
Figure 9. Key domains of SCARA5 responsible for tyrosine phosphorylation of FAK.
(A) Determination of the domains of SCARA5 required for its ability to bind FAK and inhibit FAK phosphorylation. A series of myc-tagged SCARA5 variants with truncated fragments were constructed. (B) The plasmid constructs were transfected into MHCC-LM3 cells, and then immunoprecipitation was performed using an anti-myc antibody. Immunoblotting assays were subsequently carried out with the anti-FAK antibody; 5% of the total MHCC-LM3 cell lysate was used as input. (C) The phosphorylation level of FAK (Tyr-397) was also evaluated. Quantification of phosphorylated FAK levels, as indicated by the numbers above the corresponding panels, was performed by normalizing total FAK concentrations to β-actin as a loading control.
Figure 10
Figure 10. A hypothetical schematic of the contribution of SCARA5 to HCC via activation of the FAK signaling pathway.
The physiological function of SCARA5 is to inhibit the activity of the FAK signaling pathway by physically associating with FAK. In this way, downregulation of SCARA5 due to epigenetic and genetic events in HCC may contribute to tumorigenesis and progression, possibly by activating the FAK signaling pathway via initiation of the FAK-Src-Cas complex tyrosine phosphorylation cascade, along with increased MMP-9 activity. Based on the published data (, , –71), the activating FAK-Src-Cas complex leads to tumor growth and metastasis, by promoting cell motility, invasion, cell cycle progression, survival, angiogenesis, and epithelial-to-mesenchymal transition, possibly through the secondary signaling pathways (indicated in bold). Cdc42, cell division cycle 42; CRK, v-crk sarcoma virus CT10 oncogene homolog (avian); DOCK180, dedicator of cytokinesis 1 (also known as DOCK1); Grb2, growth factor receptor-bound protein 2; PKL, paxillin kinase linker.

Similar articles

Cited by

References

    1. Herman JG, Baylin SB. Gene silencing in cancer in association with promoter hypermethylation. N Engl J Med. 2003;349(21):2042–2054. doi: 10.1056/NEJMra023075. - DOI - PubMed
    1. Bosch FX, Ribes J, Diaz M, Cléries R. Primary liver cancer: worldwide incidence and trends. Gastroenterology. 2004;127(5 Suppl 1):S5–S16. doi: 10.1053/j.gastro.2004.09.011. - DOI - PubMed
    1. Matsuda Y, Ichida T, Matsuzawa J, Sugimura K, Asakura H. p16(INK4) is inactivated by extensive CpG methylation in human hepatocellular carcinoma. Gastroenterology. 1999;116(2):394–400. doi: 10.1016/S0016-5085(99)70137-X. - DOI - PubMed
    1. Liu J, et al. Downregulation of E-cadherin by hepatitis B virus X antigen in hepatocellullar carcinoma. Oncogene. 2006;25(7):1008–1017. doi: 10.1038/sj.onc.1209138. - DOI - PubMed
    1. Kubo T, et al. Apoptotic speck protein-like, a highly homologous protein to apoptotic speck protein in the pyrin domain, is silenced by DNA methylation and induces apoptosis in human hepatocellular carcinoma. Cancer Res. 2004;64(15):5172–5177. doi: 10.1158/0008-5472.CAN-03-3314. - DOI - PubMed

Publication types

MeSH terms

Substances