. 2010 Jan;120(1):142-56.
doi: 10.1172/JCI38942. Epub 2009 Dec 21.

Pharmacologic inhibition of fatty acid oxidation sensitizes human leukemia cells to apoptosis induction

Affiliations

Pharmacologic inhibition of fatty acid oxidation sensitizes human leukemia cells to apoptosis induction

Ismael Samudio et al. J Clin Invest. 2010 Jan.

Abstract

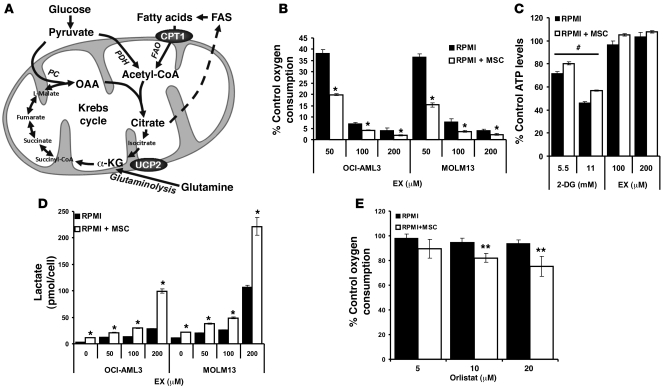
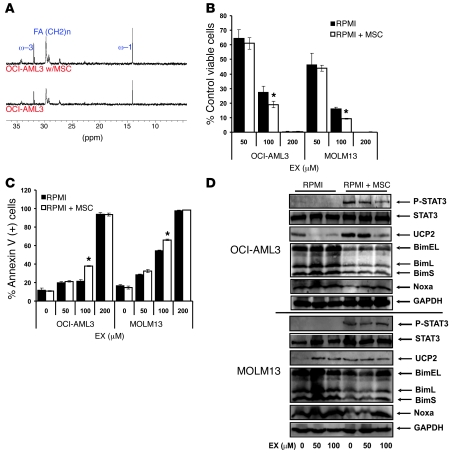
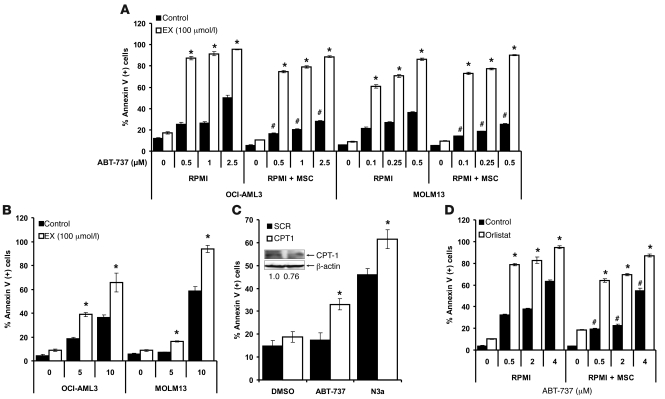
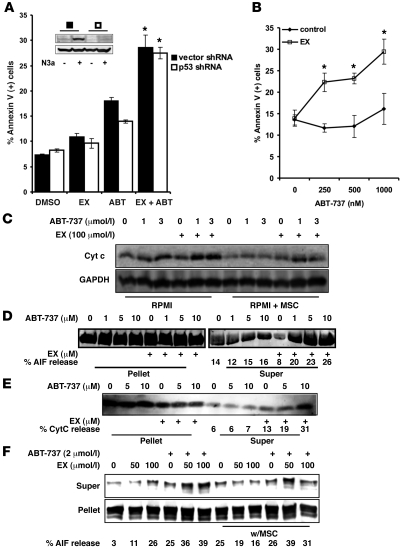
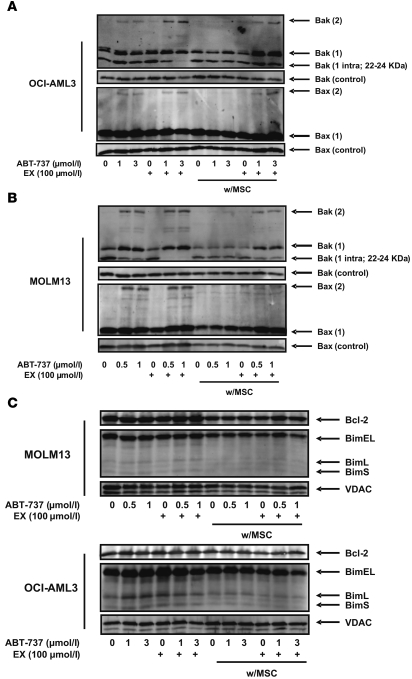
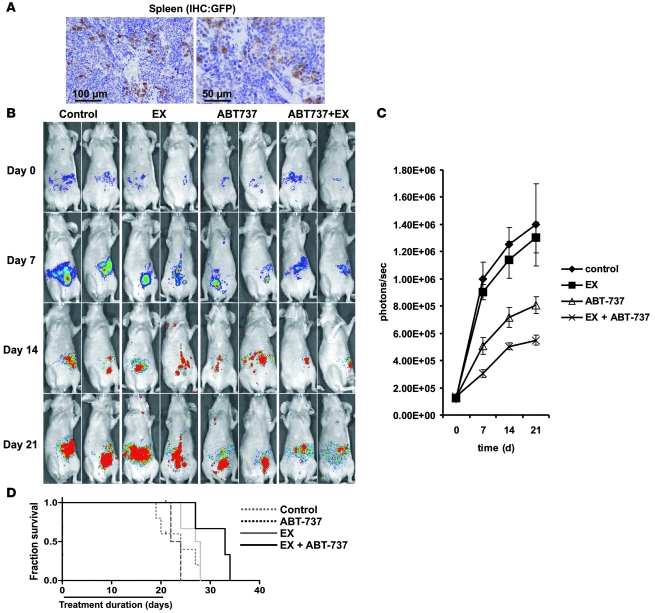
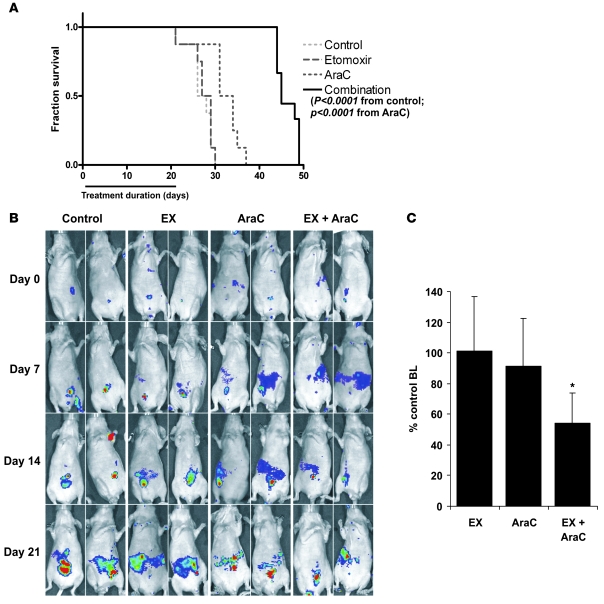
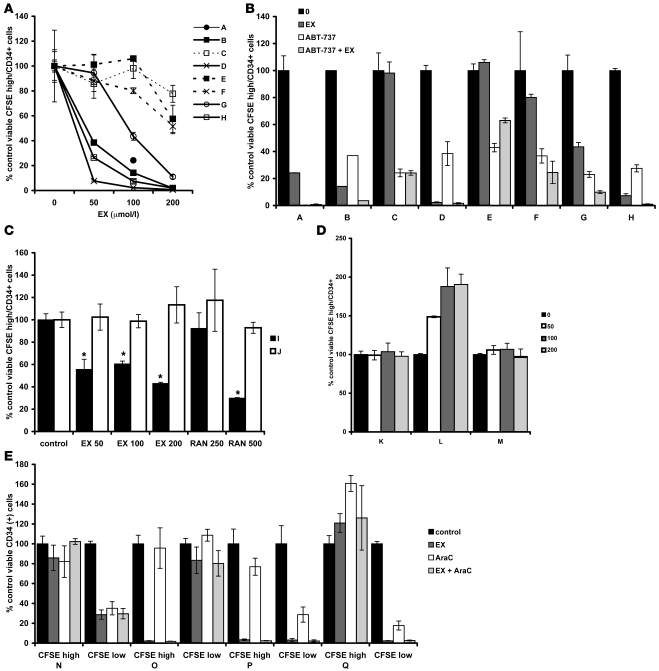
The traditional view is that cancer cells predominately produce ATP by glycolysis, rather than by oxidation of energy-providing substrates. Mitochondrial uncoupling--the continuing reduction of oxygen without ATP synthesis--has recently been shown in leukemia cells to circumvent the ability of oxygen to inhibit glycolysis, and may promote the metabolic preference for glycolysis by shifting from pyruvate oxidation to fatty acid oxidation (FAO). Here we have demonstrated that pharmacologic inhibition of FAO with etomoxir or ranolazine inhibited proliferation and sensitized human leukemia cells--cultured alone or on bone marrow stromal cells--to apoptosis induction by ABT-737, a molecule that releases proapoptotic Bcl-2 proteins such as Bak from antiapoptotic family members. Likewise, treatment with the fatty acid synthase/lipolysis inhibitor orlistat also sensitized leukemia cells to ABT-737, which supports the notion that fatty acids promote cell survival. Mechanistically, we generated evidence suggesting that FAO regulates the activity of Bak-dependent mitochondrial permeability transition. Importantly, etomoxir decreased the number of quiescent leukemia progenitor cells in approximately 50% of primary human acute myeloid leukemia samples and, when combined with either ABT-737 or cytosine arabinoside, provided substantial therapeutic benefit in a murine model of leukemia. The results support the concept of FAO inhibitors as a therapeutic strategy in hematological malignancies.


Figures

Figure 1
Figure 1. Leukemia cells uncouple FAO from ATP synthesis and rely on de novo FAS to support FAO.
(A) Schematic representation of the relevant metabolic pathways investigated. α-KG, α-ketoglutarate; PC, pyruvate carboxylase; PDH, pyruvate dehydrogenase. (B) OCI-AML3 and MOLM13 cells were grown alone or on MSC feeder layers as described in Methods, and after MACS depletion of MSCs, 2 × 10⁵ leukemia cells/well were treated with increasing concentrations of EX and monitored for oxygen consumption in Oxygen Biosensor plates for 3 hours. (C) OCI-AML3 cells were grown as in B and treated with 2-DG (5.5 and 11 mmol/l) or EX (100 and 200 μmol/l) for 6 hours, and after MACS depletion of MSCs, 2 × 10⁵ leukemia cells were lysed, and ATP levels were quantitated as described in Methods. (D) OCI-AML3 and MOLM13 cells were grown alone or on MSC feeder layers and exposed to increasing concentrations of EX for 48 hours. The number of viable cells (Annexin V–negative; tetramethyl-rhodamine methyl ester–positive) and lactate levels were quantitated as described in Methods; results are expressed as picomoles lactate per viable cell. (E) Leukemia cells were cultured as in B, treated with increasing concentrations of orlistat, and monitored for oxygen consumption in Oxygen Biosensor plates for 3 hours. *P < 0.005, **P < 0.01 versus monocultures; #P < 0.005 versus control.
Figure 2
Figure 2. Pharmacological inhibition of FAO decreases proliferation of leukemia cells cultured on MSC feeder layers.
(A) OCI-AML3 cells were grown alone or on MSC feeder layers in the presence of 11 mmol/l [1-13C]glucose for 48 hours. Lipids were extracted, and 13C spectra were acquired as described in Methods. (B) OCI-AML3 and MOLM13 cells were grown alone or on MSC feeder layers and exposed to increasing concentrations of EX for 96 hours. The number of viable cells was quantitated by flow cytometry as described in Methods. (C) Cells were cultured as in B, and the percent Annexin V–positive cells was quantitated by flow cytometry as described in Methods. (D) Monocultures and MSC cocultures of OCI-AML3 and MOLM13 cells were treated with EX for 24 hours, and after MACS depletion of MSCs, cell extracts were immunoblotted as described in Methods. *P < 0.05 versus monocultures.
Figure 3
Figure 3. Pharmacologic or genetic manipulation of β-oxidation sensitizes leukemia cells to apoptosis induced by ABT-737 or Nutlin 3a.
(A) Monocultures and MSC cocultures of OCI-AML3 and MOLM13 cells were exposed to 100 μmol/l EX alone or in combination with increasing concentrations of ABT-737 for 24 hours, and the percent Annexin V–positive cells was quantitated by flow cytometry as described in Methods. *P < 0.0001 versus control; #P < 0.01 versus monocultures. (B) Monocultures of leukemia cells were exposed to 100 μmol/l EX alone or in combination with increasing doses of Nutlin 3a for 24 (MOLM13) or 48 (OCI-AML3) hours, and the percent Annexin V–positive cells was quantitated by flow cytometry. *P < 0.001 versus control. (C) OCI-AML3 cells were electroporated with siRNA duplexes targeting CPT1 or scrambled control (SCR) duplexes as described in Methods. At 16 hours after nucleofection, cells were treated with 2 μmol/l ABT-737 or 10 μmol/l Nutlin 3a (N3a) for 24 hours, and apoptosis was analyzed by flow cytometry as described in Methods. *P < 0.01 versus scrambled siRNA. In parallel, the expression of CPT1 and β-actin in untreated SCR and CPT1 siRNA nucleofected cells was quantitated by immunoblotting as described in Methods. (D) OCI-AML3 cells alone or in coculture with MSCs were treated with 10 μM orlistat alone or in combination with increasing doses of ABT-737 for 24 hours, and the percent Annexin V–positive cells was quantitated by flow cytometry. *P < 0.0001 versus control; #P < 0.01 versus monocultures.
Figure 4
Figure 4. Inhibition of FAO facilitates mitochondrial permeability transition after ABT-737 treatment independently of p53.
(A) OCI-AML3 cells expressing a shRNA targeting p53 or their vector control counterparts were treated with 100 μmol/l EX alone or in combination with 2 μmol/l ABT-737 for 24 hours. Apoptosis was quantitated as described in Methods. Inset shows a representative Western blot of p53 and β-actin from lysates of p53 shRNA and vector shRNA cells treated with 5 μmol/l Nutlin 3a for 6 hours. (B) U937 cells were treated with 100 μmol/l EX alone or in combination with increasing doses of ABT-737 for 24 hours. Apoptosis was analyzed as above. (A and B) *P < 0.005 versus ABT-737 alone. (C) OCI-AML3 cells were cultured alone or on MSC feeder layers followed by 6 hours of treatment with 100 μmol/l EX alone or in combination with 1 or 3 μmol/l ABT-737. The levels of cytochrome c in the cytosolic fraction were determined by immunoblotting. (D and E) OCI-AML3 cells were cultured as in C and exposed to 100 μmol/l EX for 6 hours. Mitochondrial suspensions were exposed to the indicated concentrations of ABT-737, and the release of AIF (D) and cytochrome c (E) were determined by immunoblot. (F) MOLM-13 cells were cultured alone or on MSC feeder layers and exposed to 50 and 100 μmol/l EX for 6 hours. Mitochondrial suspensions were exposed to 2 μmol/l ABT-737, and the release of cytochrome c and AIF were determined by immunoblot.
Figure 5
Figure 5. Inhibition of FAO facilitates Bak and Bax oligomerization.
(A and B) Monocultures and MSC cocultures of OCI-AML3 (A) and MOLM13 (B) cells were exposed to 100 μmol/l EX alone or in combination with ABT-737 (1 or 3 μmol/l for OCI-AML3; 0.5 or 1 μmol for MOLM13) for 6 hours. Mitochondrial suspensions from leukemia monocultures and MSC cocultures (after MACS depletion of MSCs) were exposed to 0.4 mM bismaleimidohexane and immunoblotted as described in Methods. The expression of Bax and Bak in untreated (uncrosslinked) mitochondrial lysates are shown as loading controls. (C) MOLM13 and OCI-AML3 cells were cultured and treated as in A and B. Untreated (no bismaleimidohexane) mitochondrial fractions were immunoblotted for the indicated proteins.
Figure 6
Figure 6. EX enhances the therapeutic efficacy of ABT-737 in a murine model of human AML.
(A) At 5 weeks after i.v. injection of 2.5 × 10⁶ GFP/luciferase-bearing MOLM13 cells, nude mice were sacrificed, and their spleens were analyzed by immunohistochemistry for GFP+ cells. Scale bars: 100 μm (left); 50 μm (right). (B and C) Nude mice xenotransplanted as in A were randomized and treated with control liposomes, ABT-737 liposomes, EX, or EX plus ABT-737, and leukemia burden was noninvasively analyzed as described in Methods. (D) Survival was estimated by Kaplan and Meier analysis as described in Methods. The EX plus ABT-737 treatment group was significantly different from the control (P < 0.005) and ABT-737 alone (P < 0.05) groups.
Figure 7
Figure 7. EX enhances the therapeutic efficacy of Ara-C in a murine model of human AML.
(A) At 2 weeks after i.v. injection of 2.5 × 10⁶ GFP/luciferase-bearing MOLM13 cells, nude mice were randomized and treated with EX, Ara-C (100 mg/kg i.p. every other day), or EX plus Ara-C for 3 weeks, and survival was estimated by Kaplan and Meier analysis as described in Methods. (B) Noninvasive imaging of leukemia burden and progression. (C) At 2 weeks after the start of treatment (4 weeks after xenotransplantation), leukemia burden was quantitated noninvasively via bioluminescence (BL) as described in Methods.
Figure 8
Figure 8. Inhibition of FAO can decrease the number of QLPs ex vivo.
(A) Primary leukemia samples A–H were loaded with the cell tracing dye CFSE as described in Methods and exposed to increasing concentrations of EX for 5 days. Cells were then collected and stained with CD34-APC and 7-AAD, and viable CFSEhiCD34+ cells were quantitated by flow cytometry as described in Methods. Results show the mean ± SD of 3 independent experiments, except for sample B, which shows results from duplicate experiments. Sample A was only treated with 100 μmol/l EX. (B) At 20 hours prior to harvesting of samples A–H, 50 nmol/l ABT-737 was added to untreated cells or to cells exposed for 4 days to 100 μmol/l EX. CFSEhiCD34+ cells were analyzed as in A. (C) Samples I and J were treated with EX or ranolazine (RAN) at the indicated doses (in μmol/l) for 5 days, and CFSEhiCD34+ cells were analyzed by flow cytometry. *P < 0.001 versus control. (D) CML samples K, L, and M were exposed to increasing concentrations of EX for 5 days and analyzed by flow cytometry gating on viable (samples K and L) or viable and CD34+ (sample M) cells. (E) AML samples were exposed to 100 μmol/l EX alone or in combination with 100 nmol/l Ara-C for 5 days and analyzed by flow cytometry as in A.

Similar articles

Cited by

References

    1. Warburg O. On the origin of cancer cells. Science. 1956;123(3191):309–314. doi: 10.1126/science.123.3191.309. - DOI - PubMed
    1. Samudio I, Fiegl M, McQueen T, Clise-Dwyer K, Andreeff M. The Warburg effect in leukemia-stroma cocultures is mediated by mitochondrial uncoupling associated with uncoupling protein 2 activation. Cancer Res. 2008;68(13):5198–5205. doi: 10.1158/0008-5472.CAN-08-0555. - DOI - PMC - PubMed
    1. Dazzi F, Ramasamy R, Glennie S, Jones SP, Roberts I. The role of mesenchymal stem cells in haemopoiesis. Blood Rev. 2006;20(3):161–171. doi: 10.1016/j.blre.2005.11.002. - DOI - PubMed
    1. Ho AD, Wagner W. Bone marrow niche and leukemia. Ernst Schering Found Symp Proc. 2006;(5):125–139. - PubMed
    1. Konopleva M, Andreeff M. Targeting the leukemia microenvironment. Curr Drug Targets. 2007;8(6):685–701. doi: 10.2174/138945007780830827. - DOI - PubMed

Publication types

MeSH terms