. 2010 Jan;120(1):103-14.
doi: 10.1172/JCI37964. Epub 2009 Dec 28.

Mammalian target of rapamycin regulates murine and human cell differentiation through STAT3/p63/Jagged/Notch cascade

Affiliations

Mammalian target of rapamycin regulates murine and human cell differentiation through STAT3/p63/Jagged/Notch cascade

Jianhui Ma et al. J Clin Invest. 2010 Jan.

Abstract

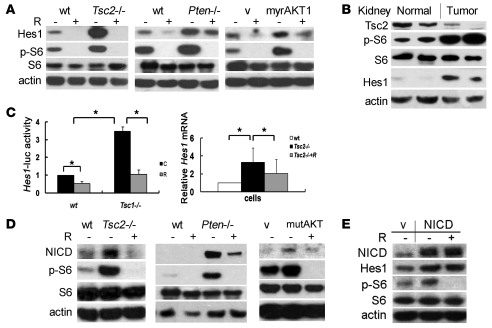
The receptor tyrosine kinase/PI3K/AKT/mammalian target of rapamycin (RTK/PI3K/AKT/mTOR) pathway is frequently altered in cancer, but the underlying mechanism leading to tumorigenesis by activated mTOR remains less clear. Here we show that mTOR is a positive regulator of Notch signaling in mouse and human cells, acting through induction of the STAT3/p63/Jagged signaling cascade. Furthermore, in response to differential cues from mTOR, we found that Notch served as a molecular switch to shift the balance between cell proliferation and differentiation. We determined that hyperactive mTOR signaling impaired cell differentiation of murine embryonic fibroblasts via potentiation of Notch signaling. Elevated mTOR signaling strongly correlated with enhanced Notch signaling in poorly differentiated but not in well-differentiated human breast cancers. Both human lung lymphangioleiomyomatosis (LAM) and mouse kidney tumors with hyperactive mTOR due to tumor suppressor TSC1 or TSC2 deficiency exhibited enhanced STAT3/p63/Notch signaling. Furthermore, tumorigenic potential of cells with uncontrolled mTOR signaling was suppressed by Notch inhibition. Our data therefore suggest that perturbation of cell differentiation by augmented Notch signaling might be responsible for the underdifferentiated phenotype displayed by certain tumors with an aberrantly activated RTK/PI3K/AKT/mTOR pathway. Additionally, the STAT3/p63/Notch axis may be a useful target for the treatment of cancers exhibiting hyperactive mTOR signaling.


Figures

Figure 1
Figure 1. Hyperactive mTOR blocks cell differentiation.
(A) Generation of MyoD- or PPARγ-expressing MEFs. Left: WT and Tsc2–/– MEFs were transduced with pMSCV (V) or pMSCV-MyoD (MyoD) retroviruses and subjected to immunoblotting for MyoD. Right: WT, Tsc1–/–, and Tsc2–/– MEFs were transduced with pMSCV (V) or pMSCV-PPARγ (PPARγ) retroviruses and subjected to immunoblotting for PPARγ. β-Actin served as a loading control. (B) WT and Tsc2–/– MEFs transduced with pMSCV-MyoD retroviruses were induced to differentiate into skeletal myocytes and form multicellular myotubes in 2% horse serum and 10 μg/ml insulin with or without varying amounts of rapamycin (R) for 5 days. Left: Myofibers (original magnification, ×200). Right: Immunoblotting for myosin (muscle marker) and p-S6 (Ser235/236, an mTOR activity marker). (C) WT, Tsc1–/–, and Tsc2–/– MEFs transduced with pMSCV-PPARγ retroviruses were induced to differentiate into adipocytes in differentiation medium with or without 1 nM rapamycin for 6 days. Left: Oil Red O staining for lipid droplets (original magnification, ×200). Right: Immunoblotting for c/EBPα and aP2 (adipogenic markers) and p-S6. C, no treatment.
Figure 2
Figure 2. mTOR is a positive regulator of Notch signaling.
(A) WT, Tsc2–/–, and Pten–/– MEFs and WT MEFs transduced with the retroviruses for myristoylated AKT1 (myrAKT1) in pLXIN-hyg or its control vector pLXIN-hyg (V) were treated with or without 10 nM rapamycin for 24 hours and then subjected to immunoblotting for Hes1 and p-S6 (Ser235/236). (B) mTOR and Notch signaling were assessed by immunoblotting in age-matched normal kidneys and 2 kidney tumors from Tsc2del3/+ mice. (C) Left: Hes1 promoter reporter luciferase assay for WT and Tsc1–/– MEFs treated with or without 10 nM rapamycin for 24 hours. The relative Hes1-luciferase activity (firefly luciferase activity/Renilla luciferase activity) is shown. Right: Quantitative real-time RT-PCR for relative Hes1 mRNA from WT and Tsc2–/– MEFs. Values are the mean ± SD of triplicate samples. *P < 0.05. (D) WT, Tsc2–/–, and Pten–/– MEFs and WT MEFs transduced with the retroviruses for AKT1E17K (mutAKT) in pLXIN-hyg or its control vector pLXIN-hyg (V) were treated with or without 10 nM rapamycin for 24 hours and then subjected to immunoblotting for active Notch1 (NICD) and p-S6. (E) WT MEFs transduced with the retroviruses for NICD in pMig (pMig-ICN1) (NICD) or its control vector pMIG (V) in the presence or absence of 10 nM rapamycin for 24 hours and then subjected to immunoblotting for p-S6, NICD, and Hes1.
Figure 3
Figure 3. Expression of the Notch ligand Jagged1 is elevated in cells with active mTOR.
(A) WT, Tsc2–/–, and Pten–/– MEFs and WT MEFs transduced with the retroviruses for myristoylated AKT1 in pLXIN-hyg or its control vector pLXIN-hyg (V) were treated with or without 10 nM rapamycin for 24 hours and then subjected to immunoblotting for Jagged1. (B) Results of quantitative real-time RT-PCR for Jagged1 mRNA in WT MEFs transduced with the retroviruses for AKT1E17K in pLXIN-hyg or its control vector pLXIN-hyg (V). Similar results are shown for Jagged1, Jagged2, Dll1, Dll3, and Dll4 mRNA in Tsc2–/– and WT MEFs. Values are the mean ± SD of triplicate samples. *P < 0.05. (C) Jagged1 siRNA treatment of Pten–/– MEFs led to reduced levels of Jagged1, NICD, and Hes1, as assessed by immunoblotting. Non–target-directed random siRNA served as a control.
Figure 4
Figure 4. mTOR regulates cell differentiation through Notch.
(A) WT, Tsc1–/–, or Tsc2–/– MEFs stably expressing exogenous PPARγ were transduced either with pMIG-DNL1 (D/N) or pMIG (V) retroviruses prior to undergoing adipogenic differentiation. (B) WT or Tsc1–/– MEFs stably expressing exogenous PPARγ were treated with or without 100 nM compound E (comp. E) during adipocyte differentiation. (C) Notch1 was knocked down with siRNA in Tsc2–/– MEFs prior to undergoing adipocyte differentiation. Non–target-directed random siRNA served as a control. (D) WT MEFs were transduced with the retroviruses for Jagged1 in pLXIN-hyg or its control vector pLXIN-hyg (V) prior to undergoing adipocyte differentiation. Left panels: Oil Red O staining for lipid droplets (original magnification, ×200). Right panels: Immunoblotting.
Figure 5
Figure 5. Inhibition of Notch suppresses the tumorigenesis of cells with activated mTOR.
(A) The proliferation of Tsc2–/– MEFs, AKT1E17K MEFs, or PC3 cells treated with or without 50 μM DAPT was examined by MTT assay. Values represent the mean ± SD of triplicate samples. *P < 0.05 (DAPT-treated cells compared with untreated cells on day 2 or 3). (B) Pten–/– MEFs transduced with either pMIG-DNL1-GFP (D/N) or pMIG (V) retroviruses were inoculated subcutaneously into nude mice and followed for tumor development and survival.
Figure 6
Figure 6. mTOR activates the Notch pathway through upregulation of p63.
(A) WT, Tsc2–/–, Pten–/–, and WT MEFs transduced with the retroviruses for AKT1E17K in pLXIN-hyg or its control vector pLXIN-hyg (V) were treated with or without 10 nM rapamycin for 24 hours and then subjected to immunoblotting for both TA and ΔN p63 and p-S6 (Ser235/236). (B) WT, Tsc1-/, Tsc2–/–, or WT MEFs transduced with the retroviruses for myristoylated AKT1 (myrAKT1) in pLXIN-hyg were transfected with p63 siRNA (RNAi) to knock down p63 expression for 48 hours and then subjected to immunoblotting. Non-target-directed random siRNA served as a control. (C) WT, Tsc1–/–, or Tsc2–/– MEFs stably expressing exogenous PPARγ were transfected with either p63 siRNA (RNAi) or non–target-directed random siRNA prior to undergoing adipogenic differentiation. Left: Oil Red O staining for lipid droplets (original magnification, ×200). Right: Immunoblotting.
Figure 7
Figure 7. STAT3 transduces mTOR signaling to the p63/Notch axis.
(A) WT and Pten–/– MEFs and WT MEFs transduced with the retroviruses for AKT1E17K in pLXIN-hyg or the control vector pLXIN-hyg (V) were treated with or without 10 nM rapamycin for 24 hours and then subjected to immunoblotting for p-S6 (Ser235/236) and p-STAT3 (Ser705). (B) Tsc1–/–, Tsc2–/–, and Pten–/– MEFs and WT MEFs transduced with the retroviruses for myristoylated AKT1 in pLXIN-hyg or the control vector pLXIN-hyg (V) were treated with or without 50 nM AG490 for 24 hours and then subjected to immunoblotting. (C) Tsc1–/– or Tsc2–/– MEFs were transfected with STAT3 siRNA to knock down STAT3 expression for 48 hours and then subjected to immunoblotting. Non–target-directed random siRNA served as a control. (D) Expression of STAT3, p63, NICD, and p-S6 were assessed in age-matched kidneys from 2 normal mice and kidney tumors from 2 Tsc2+/– mice by immunoblotting.
Figure 8
Figure 8. mTOR regulates STAT3/p63/Notch signaling in human cancers.
(A) Human breast (MCF7 and MDA-MB-468), prostate (PC3), lung (A549), pancreatic (PANC-1), and liver (HepG2) cancer cell lines were treated with 10 nM rapamycin for 24 hours and then subjected to immunoblotting for components of the mTOR/STAT/p63/Notch signaling pathway. (B) PC3 cells were transduced with either pLXIN-hyg retroviruses (V) or pLXIN-hyg-PTEN retroviruses (PTEN) and then subjected to immunoblotting for PTEN and mTOR/STAT/p63/Notch signaling pathway components. (C) Human breast cancer tissues were immunoblotted for components of the mTOR/STAT/p63/Notch signaling cascade. A representative blot is shown. The differentiation states (Diff.) of cancer cells were as indicated.
Figure 9
Figure 9. STAT3/p63/Notch signaling is controlled under mTORC1.
(A) Tsc2–/– MEFs were transfected with siRNA to knock down mTOR expression for 48 hours and then subjected to immunoblotting for p-STAT3 (Ser705), p63, and Notch components. Non–target-directed random siRNA served as a control. (B) Tsc2–/– MEFs were transfected with siRNA to knock down rictor expression for 48 hours and then subjected to immunoblotting for p-STAT3, p63, and Notch components. Non–target-directed random siRNA served as a control. (C) Schematic illustration of how the RTK/PI3K/AKT/mTOR pathway regulates cell differentiation through the STAT/p63/Jag/Notch cascade. Upon stimulation of RTKs, PI3K activates AKT, which phosphorylates TSC2 and reduces the GAP activity of the TSC1/TSC2 complex toward Rheb-GTP, increasing Rheb-GTP levels. Rheb-GTP activates mTORC1, which in turn enhances Notch signaling through upregulation of the STAT3/p63 axis. mTORC1 regulates cell differentiation through Notch signaling in a dose-dependent manner.
Figure 10
Figure 10. NF-κB and STAT3/p63 control Notch signaling downstream of mTORC1 in parallel.
(A) WT and Tsc2–/– MEFs were treated with or without 10 nM rapamycin for 24 hours and then subjected to immunoblotting for NF-κB (p65), IκBα, and mTOR signaling. (B) Tsc2–/– MEFs were transfected with p65 siRNA or STAT3 siRNA to knock down p65 or STAT3 expression for 48 hours and were then subjected to immunoblotting for STAT3 and NF-κB signaling. Non–target-directed random siRNA served as a control. (C) Schematic illustration of how NF-κB and STAT3/p63 regulate Notch signaling downstream of mTORC1 in parallel.

Comment in

Similar articles

Cited by

References

    1. Manning BD, Cantley LC. AKT/PKB signaling: navigating downstream. Cell. 2007;129(7):1261–1274. doi: 10.1016/j.cell.2007.06.009. - DOI - PMC - PubMed
    1. Sabatini DM. mTOR and cancer: insights into a complex relationship. Nat Rev Cancer. 2006;6(9):729–734. doi: 10.1038/nrc1974. - DOI - PubMed
    1. Kim DH, et al. mTOR interacts with raptor to form a nutrient-sensitive complex that signals to the cell growth machinery. Cell. 2002;110(2):163–175. doi: 10.1016/S0092-8674(02)00808-5. - DOI - PubMed
    1. Hara K, et al. Raptor, a binding partner of target of rapamycin (TOR), mediates TOR action. Cell. 2002;110(2):177–189. doi: 10.1016/S0092-8674(02)00833-4. - DOI - PubMed
    1. Inoki K, Zhu T, Guan KL. TSC2 mediates cellular energy response to control cell growth and survival. Cell. 2003;115(5):577–590. doi: 10.1016/S0092-8674(03)00929-2. - DOI - PubMed

Publication types

MeSH terms