. 2010 Jan;120(1):93-102.
doi: 10.1172/JCI40221. Epub 2009 Dec 28.

The evolutionarily conserved TSC/Rheb pathway activates Notch in tuberous sclerosis complex and Drosophila external sensory organ development

Affiliations

The evolutionarily conserved TSC/Rheb pathway activates Notch in tuberous sclerosis complex and Drosophila external sensory organ development

Magdalena Karbowniczek et al. J Clin Invest. 2010 Jan.

Abstract

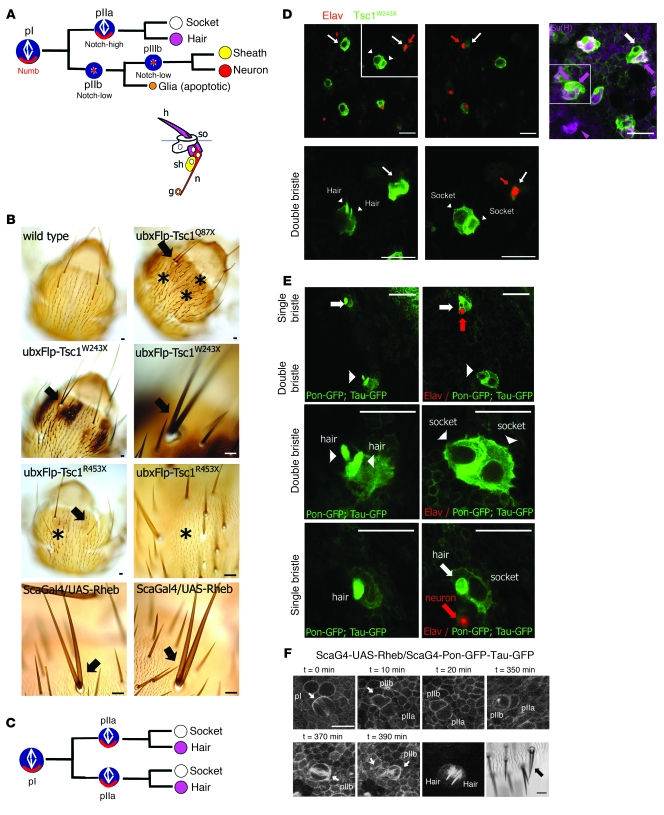
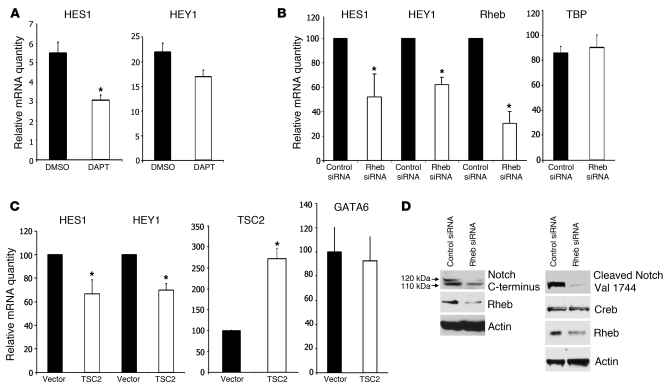
Mutations in either of the genes encoding the tuberous sclerosis complex (TSC), TSC1 and TSC2, result in a multisystem tumor disorder characterized by lesions with unusual lineage expression patterns. How these unusual cell-fate determination patterns are generated is unclear. We therefore investigated the role of the TSC in the Drosophila external sensory organ (ESO), a classic model of asymmetric cell division. In normal development, the sensory organ precursor cell divides asymmetrically through differential regulation of Notch signaling to produce a pIIa and a pIIb cell. We report here that inactivation of Tsc1 and overexpression of the Ras homolog Rheb each resulted in duplication of the bristle and socket cells, progeny of the pIIa cell, and loss of the neuronal cell, a product of pIIb cell division. Live imaging of ESO development revealed this cell-fate switch occurred at the pIIa-pIIb 2-cell stage. In human angiomyolipomas, benign renal neoplasms often found in tuberous sclerosis patients, we found evidence of Notch receptor cleavage and Notch target gene activation. Further, an angiomyolipoma-derived cell line carrying biallelic TSC2 mutations exhibited TSC2- and Rheb-dependent Notch activation. Finally, inhibition of Notch signaling using a gamma-secretase inhibitor suppressed proliferation of Tsc2-null rat cells in a xenograft model. Together, these data indicate that the TSC and Rheb regulate Notch-dependent cell-fate decision in Drosophila and Notch activity in mammalian cells and that Notch dysregulation may underlie some of the distinctive clinical and pathologic features of TSC.


Figures

Figure 1
Figure 1. Tsc and Rheb regulate Notch-dependent cell-fate decisions in Drosophila.
(A) The ESO lineage arises from a SOP cell (pI) and consists of 5 cells: 2 external cells, the hair (h) and socket (so), and 3 internal cells, the neuron (n), sheath (sh), and apoptotic glial cell (g). Numb (red) is asymmetrically localized in the mitotic pI and pIIa cells. The mitotic spindles of the pI and pIIa cells align on an anterior-posterior axis; the spindles of the pIIb and pIIIb cells align along the apical-basal axis. (B) Missing bristles and bald patches (asterisks) and duplicated bristles (arrows) in both Tsc mutant clones and Rheb-overexpressing ESOs. (C) Rheb expression inappropriately induces Notch activity in the pIIb cell, causing it to divide in a pIIa-like manner, resulting in a duplicate socket and hair cell. (D and E) Both correct cell fate specification (white arrows) and loss of internal neuron (Elav, red, red arrows) and extra socket [Su(H), purple, arrows and arrowhead] cells in Tsc1 mutant clones (GFP, green) and Rheb-overexpressing ESOs. All panels are single XY sections extracted from a Z series. (D) Bottom panels are higher-magnification images of the boxed area from the top left panel. Tsc mutant organs exhibit extra external cells and loss neuron phenotypes (arrowheads). Su(H) immunostaining (top right panel, purple arrows) confirmed extra socket (boxed area). (E) Rheb overexpression results in duplication of external cells (white arrowheads) and loss of neurons (Elav, red). (F) Representative example of live imaging of a pIIb-to-pIIa cell-fate switch in Rheb-expressing pI cells, leading to sensory organ twinning phenotype. pI and pIIb cells divide within the plane of the epithelium (white arrows) and segregate Pon-GFP correctly to 1 daughter cell. Scan of the same cells in the living pupa at 12 hours after division reveals a double socket and double hair ESO, and the thorax of the same adult fly showed a sensory organ twinning from this SOP cluster (black arrow). Scale bar: 10 μm (B and DF).
Figure 2
Figure 2. Genetic interaction of Rheb with other genes involved in sensory organ development.
(A) Quantification of the twinning phenotype in scaGal4, UAS-Rab11 (Rab11); scaGal4, UAS-Rheb/Rab11 (Rheb/Rab11); scaGal4-UAS-Nuf (Nuf); scaGal4, UAS-Rheb/Nuf (Rheb/Nuf); scaGal4, UAS-Rheb/CyO (Rheb); scaGal4, UAS-l(2)gl3A [l(2)gl3A]; and scaGal4, UAS-Rheb/l(2)gl3A [Rheb/l(2)gl3A] flies (also see Supplemental Table 1). The bars indicate percentage of transformed ESOs. Data represent mean ± SEM. *P < 0.001. (B) Examples of the twinning phenotype (arrows) in scaGal4, UAS-l(2)gl3A and scaGal4, UAS-Rheb/l(2)gl3A flies. Original magnification, ×100.
Figure 3
Figure 3. Expression of NOTCH1, DLL1, and HES1 in angiomyolipoma tumors.
The level of NOTCH1 (A), DLL1 (B), and HES1 (C) transcript was measured by RT-PCR in 4 angiomyolipomas from a TSC patient, compared with normal kidney. Data represent mean ± SEM. *P < 0.05.
Figure 4
Figure 4. Evidence of Notch activation in angiomyolipomas.
The level of cleaved Notch1 and Hes1 measured by Western blot in sporadic angiomyolipomas and normal kidney from 4 patients. Activated Notch1 was identified by examination of the 110-kDa band, which represents the γ-secretase cleavage product of Notch1 receptor.
Figure 5
Figure 5. Rheb-dependent Notch activation in a TSC2-null angiomyolipoma-derived cell line (621-101 cells).
(A) Seventy-two hours of 10 μM DAPT treatment in 621-101 cells decreased endogenous HES1 and HEY1 transcripts measured by real-time PCR. Data represent mean ± SEM. *P < 0.05. (B) Downregulation of Rheb in 621-101 cells decreased endogenous HES1 and HEY1 transcripts measured by real-time PCR relative to control siRNA. TATA box–binding protein (TBP) transcript was used as a control for changes in global RNA abundance and was not affected by downregulation of Rheb. Data represent mean ± SEM. *P < 0.05. (C) Reexpression of tuberin in 621-101 cells decreased HES1 and HEY1 transcripts relative to vector control. GATA6 transcript was used as a control and was not affected by tuberin reexpression. Data represent mean ± SEM. *P < 0.05. (D) Downregulation of Rheb by siRNA decreased levels of the 110-kDa band, representing the γ-secretase cleaved, active form of the Notch1 receptor (lower arrow) in 621-101 cells (left panels) in the whole-cell lysate and decreased levels of cleaved Notch1 at Val 1744 (right panels) in the nucleus. Actin and Creb were used as loading controls.
Figure 6
Figure 6. Rheb-dependent Notch activation in mammalian cells.
(A) Endogenous HES1 transcript levels measured by real-time PCR were higher in Tsc2–/–p53–/– MEFs, compared with Tsc2+/+p53–/– MEFs. Data represent mean ± SEM. *P < 0.05. (B) Rheb siRNA decreased HEY1-luciferase activity in 3 melanoma-derived cell lines and HES1-luciferase activity in 2 of 3 lines, relative to control siRNA. Cells were transfected with HEY1- or HES1-luciferase and with Rheb or control siRNA. Values were corrected to cells transfected with a promoter-less luciferase construct. Rheb downregulation was confirmed by immunoblot. Data represent mean ± SEM. *P < 0.05. (C and D) TSC2 downregulation increased and Rheb downregulation decreased HEY1-luciferase activity relative to control siRNA. HEK293 cells were transfected with HEY1–luciferase (HEY-1Luc) or promoter-less control and TSC2 (C) or Rheb siRNAs (D). TSC2 and Rheb downregulation was confirmed by immunoblot. Data represent mean ± SEM. *P < 0.05. (E) Rapamycin did not inhibit the HEY1-luciferase activity induced by loss of TSC2. HEK293 cells were transfected with HEY1-luciferase or promoter-less construct, followed by control or TSC2 siRNA, and incubated for 72 hours with DMSO or 20 nM rapamycin. Data represent mean ± SEM. *P < 0.05.
Figure 7
Figure 7. Notch cleavage is insensitive to TORC1 inhibition in patient-derived cells.
(A) Levels of the 110-kDa band representing the γ-secretase cleaved, active form of the Notch receptor, were decreased following treatment with the γ-secretase inhibitor DAPT as expected, while in rapamycin and DMSO treated cells, the 110-kDa band was present. Rapamycin inhibited the phosphorylation of ribosomal protein S6 as expected. (B) Treatment with the Tor kinase inhibitor Torin 1 did not inhibit Notch cleavage in 621-101 cells but did inhibit the phosphorylation of ribosomal protein S6. DAPT did inhibit the 110-kDa cleaved Notch band as expected. (C) Raptor downregulation did not inhibit Notch cleavage but did inhibit the phosphorylation of ribosomal protein S6. Actin and Creb were used as loading controls.
Figure 8
Figure 8. DAPT suppresses growth, proliferation, and Notch pathway activation in Tsc2-null xenograft tumors.
(A) Growth of Tsc2-null ELT3 cell xenograft tumors in mice treated with DAPT (10 mg/kg/d) or placebo control. Data represent tumor volume (mm3) (mean ± SEM of DAPT-treated (n = 4) or placebo-treated (n = 3) mice. *P < 0.05. (B) Ki-67 staining of placebo- (left panel) and DAPT-treated (right panel) xenograft tumors (original magnification, ×100) and quantification of results. DAPT treatment reduced the proliferation index. Data represent mean ± SEM. *P < 0.05. (C) DAPT treatment of Tsc2-null tumors decreased endogenous Hes1 transcript level, measured by real-time PCR (mean ± SEM; *P < 0.05), and the level of Hes1 protein (arrow, upper band), measured by immunoblot.

Comment in

Similar articles

Cited by

References

    1. Crino PB, Henske EP. New developments in the neurobiology of the tuberous sclerosis complex. Neurology. 1999;53(7):1384–1390. - PubMed
    1. Plank TL, Yeung RS, Henske EP. Hamartin, the product of the tuberous sclerosis 1 (TSC1) gene, interacts with tuberin and appears to be localized to cytoplasmic vesicles. Cancer Res. 1998;58(21):4766–4770. - PubMed
    1. Tee AR, Manning BD, Roux PP, Cantley LC, Blenis J. Tuberous sclerosis complex gene products, Tuberin and Hamartin, control mTOR signaling by acting as a GTPase-activating protein complex toward Rheb. Curr Biol. 2003;13(15):1259–1268. doi: 10.1016/S0960-9822(03)00506-2. - DOI - PubMed
    1. Inoki K, Li Y, Xu T, Guan KL. Rheb GTPase is a direct target of TSC2 GAP activity and regulates mTOR signaling. Genes Dev. 2003;17(15):1829–1834. doi: 10.1101/gad.1110003. - DOI - PMC - PubMed
    1. Garami A, et al. Insulin activation of Rheb, a mediator of mTOR/S6K/4E-BP signaling, is inhibited by TSC1 and 2. Mol Cell. 2003;11(6):1457–1466. doi: 10.1016/S1097-2765(03)00220-X. - DOI - PubMed

Publication types

MeSH terms