. 2010 Apr;202(2):271-90.
doi: 10.1007/s00221-009-2130-9. Epub 2009 Dec 29.

Parabrachial nucleus neuronal responses to off-vertical axis rotation in macaques

Affiliations

Parabrachial nucleus neuronal responses to off-vertical axis rotation in macaques

Cyrus H McCandless et al. Exp Brain Res. 2010 Apr.

Abstract

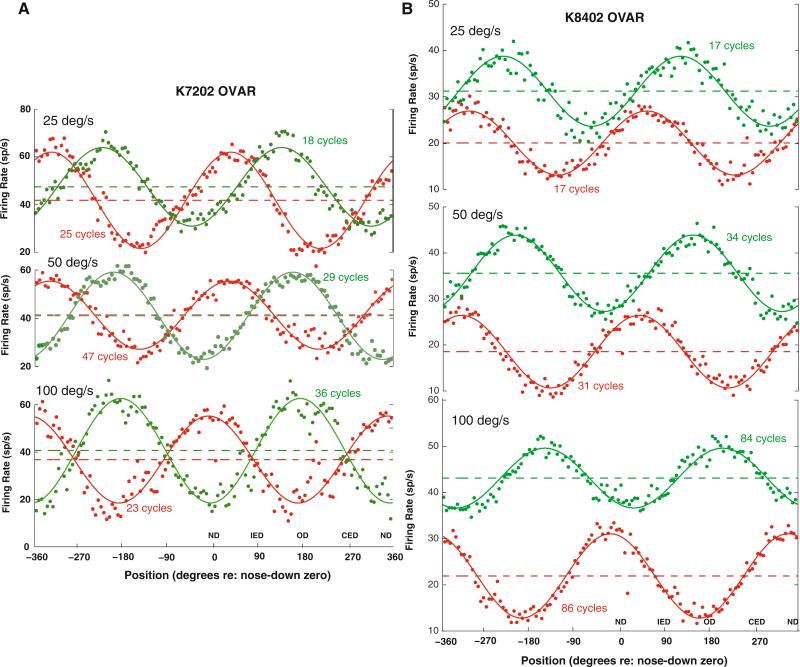
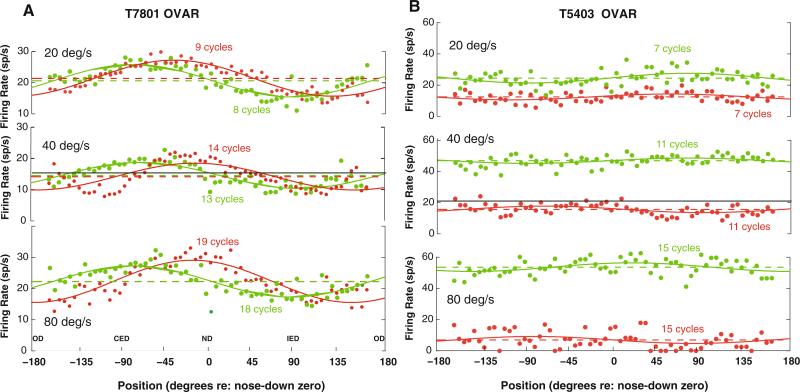
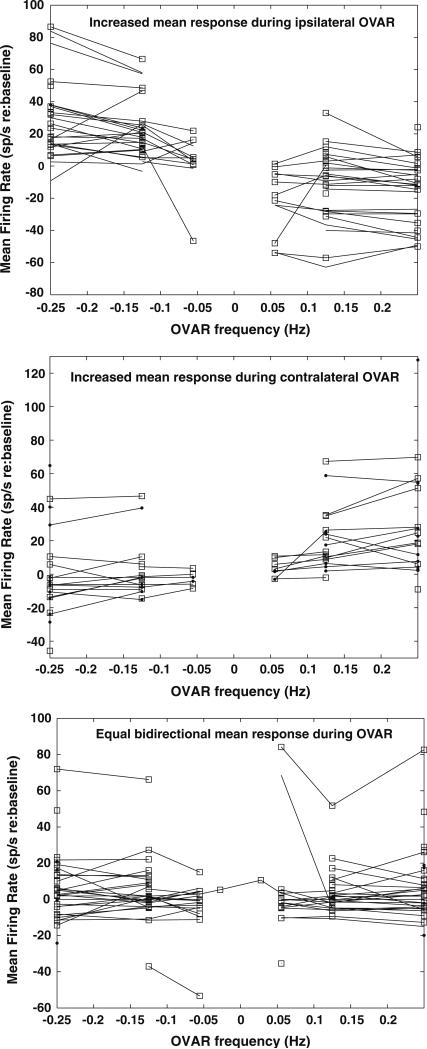
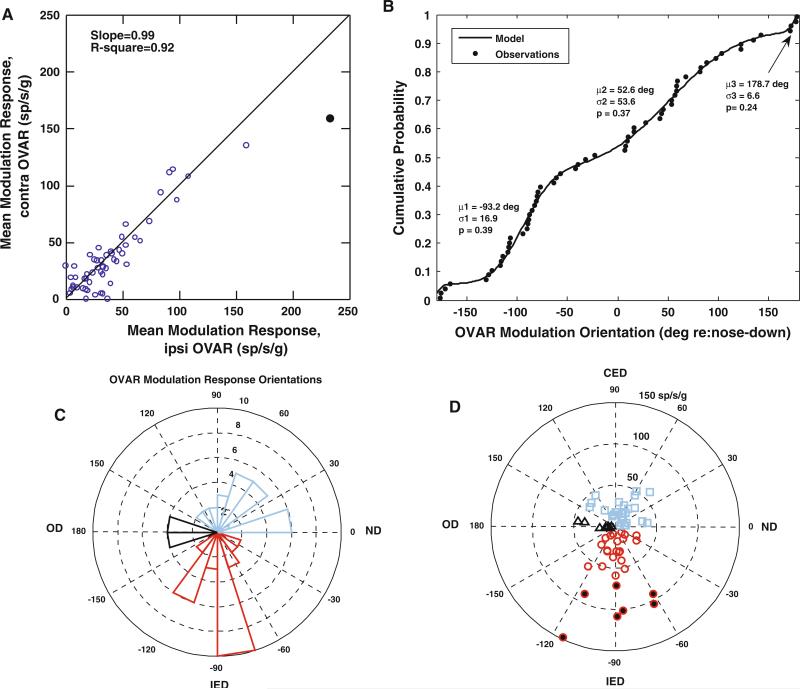
The caudal aspect of the parabrachial nucleus (PBN) contains neurons responsive to whole body, periodic rotational stimulation in alert monkeys (Balaban et al. in J Neurophysiol 88:3175-3193, 2002). This study characterizes the angular and linear motion-sensitive response properties of PBN unit responses during off-vertical axis rotation (OVAR) and position trapezoid stimulation. The OVAR responses displayed a constant firing component which varied from the firing rate at rest. Nearly two-thirds of the units also modulated their discharges with respect to head orientation (re: gravity) during constant velocity OVAR stimulation. The modulated response magnitudes were equal during ipsilateral and contralateral OVARs, indicative of a one-dimensional accelerometer. These response orientations during OVAR divided the units into three spatially tuned populations, with peak modulation responses centered in the ipsilateral ear down, contralateral anterior semicircular canal down, and occiput down orientations. Because the orientation of the OVAR modulation response was opposite in polarity to the orientation of the static tilt component of responses to position trapezoids for the majority of units, the linear acceleration responses were divided into colinear dynamic linear and static tilt components. The orientations of these unit responses formed two distinct population response axes: (1) units with an interaural linear response axis and (2) units with an ipsilateral anterior semicircular canal-contralateral posterior semicircular canal plane linear response axis. The angular rotation sensitivity of these units is in a head-vertical plane that either contains the linear acceleration response axis or is perpendicular to the linear acceleration axis. Hence, these units behave like head-based ('strapdown') inertial guidance sensors. Because the PBN contributes to sensory and interoceptive processing, it is suggested that vestibulo-recipient caudal PBN units may detect potentially dangerous anomalies in control of postural stability during locomotion. In particular, these signals may contribute to the range of affective and emotional responses that include panic associated with falling, malaise associated with motion sickness and mal-de-debarquement, and comorbid balance and anxiety disorders.

Keywords: Alert non-human primate; Electrophysiology; Linear acceleration sensitivity; Vestibular.


Figures

Fig. 1
Fig. 1
Examples of responses of two PBN units during constant velocity OVAR. The green trace shows responses during rotation toward the recorded side (ipsilateral rotation), while the red trace shows responses during rotation in the contralateral direction. The data are averaged across a window spanning two cycles of rotation. The head orientation relative to gravity is labeled relative to nose down (ND) as 0° and occiput down (OD) as 180°. The ipsilateral ear down (IED, +90°) and contralateral ear down (CED, –90°) orientations are also labeled. The constant speed of OVAR is listed for each pair of traces. The points indicate the average instantaneous spike rate and the solid line indicates the best least-squares fit of a constant baseline plus cosine modulation model to the data for the indicated number of steady state cycles of rotation (see text). The dashed line shows the baseline level for each unit in each stimulus condition, and the solid black line shows the background mean discharge rate. a The behavior of a PBN unit with a modulation response component and a baseline response component that are insensitive to a fourfold change in OVAR speed. b An example of a PBN unit with a significant modulation response component and with a baseline component that varies with the direction of rotation
Fig. 2
Fig. 2
Two additional examples of the discharge rates of PBN units during constant velocity OVAR stimulation. The green trace shows responses during rotation toward the recorded side (ipsilateral rotation), while the red trace shows responses during rotation in the contralateral direction. The data are averaged across a window spanning one cycle of rotation. The head orientation relative to gravity is labeled in radians relative to nose down (ND) as zero and occiput down (OD) as ±180°. The ipsilateral ear down (IED) and contralateral ear down (CED) orientations are also labeled. The constant speed of OVAR is listed for each pair of traces. The points indicate the average instantaneous spike rate and the solid line indicates the best least-squares fit of a constant baseline plus cosine modulation model to the data (see text). The dashed line shows the baseline level for each unit in each stimulus condition, and the solid black line shows the background mean discharge rate. a The behavior of a PBN unit from another monkey with a small modulation response component and a baseline response component that did not change across OVAR stimulus velocities. b An example of a PBN unit with no significant modulation response during OVAR, but with a baseline component that varies with both the velocity and the direction of rotation
Fig. 3
Fig. 3
Mean firing rate patterns of PBN neurons during OVAR relative to baseline discharges. The baseline firing rate at rest was subtracted from the mean value of the response during OVAR. The upper panel shows the mean firing rates of units that showed an increasing mean discharge rate during ipsilaterally directed constant velocity OVAR and a decreasing rate during contralaterally directed OVAR. The middle panel shows the mean firing rates of units that showed a decreasing mean discharge rate during ipsilaterally directed constant velocity OVAR and an increasing rate during contralaterally directed OVAR. The lower panel shows the mean firing rates of units that showed an equal mean discharge rate during OVAR directed both ipsilaterally and contralaterally
Fig. 4
Fig. 4
The upper panels show the gain and orientation of the cosinusoidal modulation of unit responses during OVAR for majority of the cells, which were constant across the range of stimuli employed. The lower panels show the same properties for seven units with response orientations that varied with OVAR stimulus frequency of revolution
Fig. 5
Fig. 5
OVAR modulation response properties of PBN units. a A scatter plot of the relationship between the mean modulation response gains of individual units during ipsilaterally- (ipsi) and contralaterally- (contra) directed constant velocity OVAR. The responses tend to be equal in both directions; a linear relationship with a slope of 0.99 (model with no constant term) accounts for 92% of the variance. b The empirical cumulative distribution function of the orientations of the OVAR modulation responses of the PBN units in the sample. The line shows a model fit for a mixture of three wrapped normal distributions (means μ1, μ2, and μ3; standard deviations σ1, σ2, and σ3; proportions of observations p1, p2, and p3). The details of the least-squared estimation procedure, based on an order statistics approach, are described in the text. c A polar histogram of orientations of the units and d a polar coordinate plot of the depth of modulation as a function of the best mean response orientation of the unit. By convention, 0° represents the nose down, 90° the contralateral ear down, –90° the ipsilateral ear down, and 180° the occiput down orientations. The units with peak modulation responses in the ipsilateral ear down orientation are shown in cyan bars in c and cyan squares in d. Units with peak modulation responses in the contralateral ear down orientation are designated by red bars in c and red circles in d, with circles filled in black indicating high sensitivity units. Finally, units with peak modulation responses in the occiput down orientation are shown by black bars in c and black triangles in d
Fig. 6
Fig. 6
a A low magnification photomicrograph of a transverse section through PBN of a macaque. The PBN surrounds the superior cerebellar peduncle (scp): medial (m), external medial (em), external (e), and lateral (l) subnuclei of the PBN are labeled. Note the clear demarcation between the borders of the PBN and the principal sensory trigeminal nucleus (P5). b A higher magnification view of the external medial (em) and external subnuclei; the same blood vessel is marked by a single asterisk in a and b. c A higher magnification view of the medial parabrachial subnucleus (m); the two asterisks mark the same blood vessel in a and c. Calibration bar 1 mm in a; 200 μm in b and c
Fig. 7
Fig. 7
The distribution of PBN units is charted as a function of OVAR modulation response orientation for the caudal PBN (more than 0.5 mm caudal to the center of the responsive region), central 1 mm of PBN, and rostral PBN (more than 0.5 mm rostral to the center of the responsive region). The location of the medial region of the PBN (MPBN medial and external medial subnuclei), lateral region of the PBN (LPBN external and lateral subnuclei), and the superior cerebellar peduncle (scp) are indicated. The upper row illustrates the distribution of units with a significant OVAR modulation response. The lower row shows the distribution of units with no significant OVAR modulation
Fig. 8
Fig. 8
The phase of OVAR modulation response of PBN units is plotted as a function of frequency of revolution in a. Individual units showed either a phase-leading or phase-lagging pattern that did not change across the frequencies tested. b The empirical cumulative distribution function of the mean phase responses of these units. The line shows a model fit for a mixture of two wrapped normal distributions with respective means (μ), standard deviations (σ), and proportions of observations (p), confirming the consistency of the data with two different response phase populations
Fig. 9
Fig. 9
Relationships between the gains and orientations of the OVAR modulation responses and the static tilt response estimates (from position trapezoid stimuli) for PBN units. a A scatter plot of the response gains of single units, estimated from OVAR and position trapezoids. Note that the majority of units have nearly equal gains under the two stimulus conditions. b A histogram of the difference between the best mean orientations of the OVAR responses and the orientations of the static tilt responses. The distribution indicates that the response orientations in dynamic (OVAR) and static (position trapezoid) testing conditions are of opposite polarity but along a single axis. c A polar histogram of the distribution of the best dynamic linear response orientations. The thick sectors indicate the interaural axis units, while the thin sectors indicate units with peak response orientations in the ipsilateral anterior-contralateral posterior semicircular canal plane
Fig. 10
Fig. 10
The distribution of PBN units is charted as a function of the dynamic linear response orientation (OVAR modulation response minus static tilt response component during position trapezoid testing). Separate panels represent the caudal PBN (more than 0.5 mm caudal to the center of the responsive region), central 1 mm of PBN, and rostral PBN (more than 0.5 mm rostral to the center of the responsive region). The location of the medial aspect of the PBN (MPBN medial and external medial subnuclei), lateral aspect of the PBN (LPBN external and lateral subnuclei), and the superior cerebellar peduncle (scp) are indicated. The upper row illustrates the distribution of units with estimated dynamic linear acceleration sensitivity oriented along the interaural axis, with response polarity in either the ipsilateral ear down or contralateral ear down orientation. The lower row shows the distribution of units with estimated dynamic linear responses aligned with the ipsilateral anterior semicircular canal-contralateral posterior semicircular canal (IAC-CPC) axis, with response polarity in either the IAC down or the CPC down orientation

Similar articles

Cited by

References

    1. Angelaki DE, Dickman JD. Spatiotemporal processing of linear acceleration: primary afferent and central vestibular neuron responses. J Neurophysiol. 2000;84:2113–2132. - PubMed
    1. Balaban CD. Vestibular nucleus projections to the parabrachial nucleus in rabbits: implications for vestibular influences on autonomic function. Exp Brain Res. 1996;108:367–381. - PubMed
    1. Balaban CD. Vestibular autonomic regulation. Curr Opin Neurol. 1999;12:29–33. - PubMed
    1. Balaban CD. Projections from the parabrachial nucleus to the vestibular nuclei: potential substrates for autonomic and limbic influences on vestibular responses. Brain Res. 2004;996:126–137. - PubMed
    1. Balaban CD, Thayer JF. Neurological bases for balance-anxiety links. J Anxiety Disord. 2001;15:53–79. - PubMed

Publication types