Developmental experience alters information coding in auditory midbrain and forebrain neurons
- PMID: 20039264
- PMCID: PMC2909447
- DOI: 10.1002/dneu.20783
Developmental experience alters information coding in auditory midbrain and forebrain neurons
Abstract
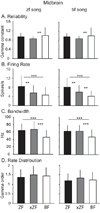
In songbirds, species identity and developmental experience shape vocal behavior and behavioral responses to vocalizations. The interaction of species identity and developmental experience may also shape the coding properties of sensory neurons. We tested whether responses of auditory midbrain and forebrain neurons to songs differed between species and between groups of conspecific birds with different developmental exposure to song. We also compared responses of individual neurons to conspecific and heterospecific songs. Zebra and Bengalese finches that were raised and tutored by conspecific birds, and zebra finches that were cross-tutored by Bengalese finches were studied. Single-unit responses to zebra and Bengalese finch songs were recorded and analyzed by calculating mutual information (MI), response reliability, mean spike rate, fluctuations in time-varying spike rate, distributions of time-varying spike rates, and neural discrimination of individual songs. MI quantifies a response's capacity to encode information about a stimulus. In midbrain and forebrain neurons, MI was significantly higher in normal zebra finch neurons than in Bengalese finch and cross-tutored zebra finch neurons, but not between Bengalese finch and cross-tutored zebra finch neurons. Information rate differences were largely due to spike rate differences. MI did not differ between responses to conspecific and heterospecific songs. Therefore, neurons from normal zebra finches encoded more information about songs than did neurons from other birds, but conspecific and heterospecific songs were encoded equally. Neural discrimination of songs and MI were highly correlated. Results demonstrate that developmental exposure to vocalizations shapes the information coding properties of songbird auditory neurons.
Figures


Similar articles
-
Early social experience alters transcriptomic responses to species-specific song stimuli in female songbirds.Behav Brain Res. 2018 Jul 16;347:69-76. doi: 10.1016/j.bbr.2018.02.034. Epub 2018 Mar 1. Behav Brain Res. 2018. PMID: 29501507
-
Experience dependence of neural responses to different classes of male songs in the primary auditory forebrain of female songbirds.Behav Brain Res. 2013 Apr 15;243:184-90. doi: 10.1016/j.bbr.2013.01.007. Epub 2013 Jan 15. Behav Brain Res. 2013. PMID: 23333401 Free PMC article.
-
The neural response of female zebra finches (Taeniopygia guttata) to conspecific, heterospecific, and isolate song depends on early-life song exposure.Behav Processes. 2019 Jun;163:37-44. doi: 10.1016/j.beproc.2017.12.022. Epub 2017 Dec 21. Behav Processes. 2019. PMID: 29274763
-
Song- and order-selective neurons develop in the songbird anterior forebrain during vocal learning.J Neurobiol. 1997 Nov;33(5):694-709. J Neurobiol. 1997. PMID: 9369467 Review.
-
Coevolution in communication senders and receivers: vocal behavior and auditory processing in multiple songbird species.Ann N Y Acad Sci. 2011 Apr;1225:155-65. doi: 10.1111/j.1749-6632.2011.05989.x. Ann N Y Acad Sci. 2011. PMID: 21535002 Free PMC article. Review.
Cited by
-
Processing of communication sounds: contributions of learning, memory, and experience.Hear Res. 2013 Nov;305:31-44. doi: 10.1016/j.heares.2013.06.005. Epub 2013 Jun 18. Hear Res. 2013. PMID: 23792078 Free PMC article. Review.
-
Local inhibition modulates learning-dependent song encoding in the songbird auditory cortex.J Neurophysiol. 2013 Feb;109(3):721-33. doi: 10.1152/jn.00262.2012. Epub 2012 Nov 14. J Neurophysiol. 2013. PMID: 23155175 Free PMC article.
-
Adult-like neural representation of species-specific songs in the auditory forebrain of zebra finch nestlings.Dev Neurobiol. 2021 Mar;81(2):123-138. doi: 10.1002/dneu.22802. Epub 2021 Jan 29. Dev Neurobiol. 2021. PMID: 33369121 Free PMC article.
-
Sexual imprinting misguides species recognition in a facultative interspecific brood parasite.Proc Biol Sci. 2010 Oct 22;277(1697):3079-85. doi: 10.1098/rspb.2010.0592. Epub 2010 May 19. Proc Biol Sci. 2010. PMID: 20484239 Free PMC article.
-
Tracing development of song memory with fMRI in zebra finches after a second tutoring experience.Commun Biol. 2023 Mar 30;6(1):345. doi: 10.1038/s42003-023-04724-2. Commun Biol. 2023. PMID: 36997617 Free PMC article.
References
-
- Bass AH, Rose GJ, Pritz MB. Auditory Midbrain of Fish, Amphibians and Reptiles: Model Systems for Understanding Auditory Function. In: Winer JA, Schreiner CE, editors. The Inferior Colliculus. New York: Springer Press; 2005. pp. 459–492.
-
- Bischof, Clayton NS. Stabilization of sexual preferences by sexual experience in male zebra finches Taeniopygia guttata castanotis. Behaviour. 1991;118:144–154.
-
- Campbell DLM, Hauber ME. Spatial and behavioural measures of social discrimination by captive male zebra finches: Implications of sexual and species differences for recognition research. Behavioural Processes. 2009a;80:90–98. - PubMed
Publication types
MeSH terms
Grants and funding
LinkOut - more resources
Full Text Sources

