

Estimation of genotype relative risks from pedigree data by retrospective likelihoods
- PMID: 20039378
- PMCID: PMC2860197
- DOI: 10.1002/gepi.20460
Estimation of genotype relative risks from pedigree data by retrospective likelihoods
Abstract
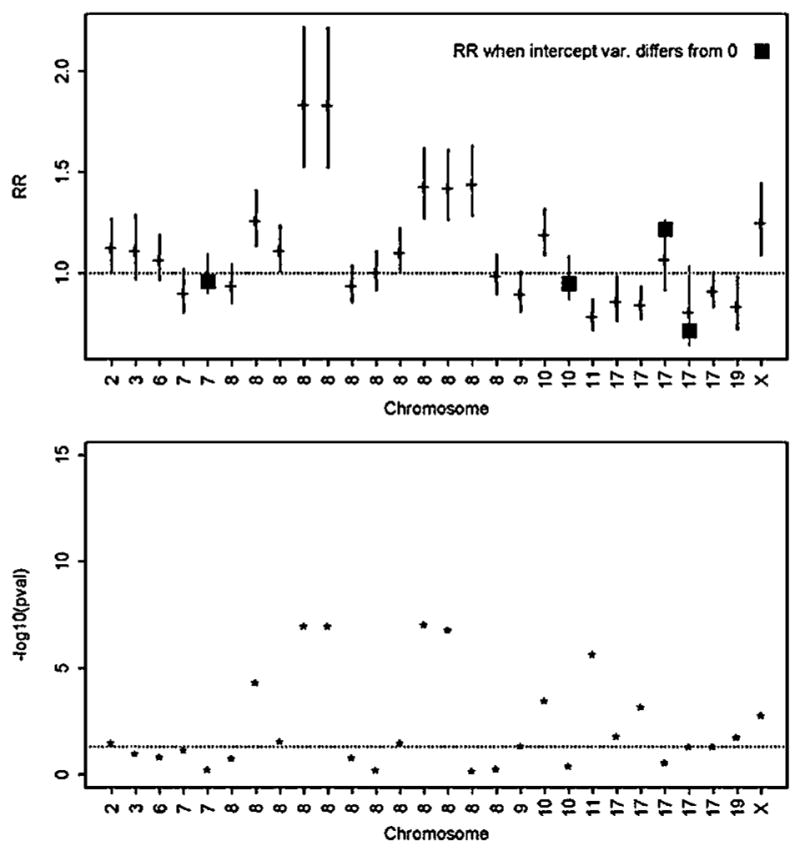
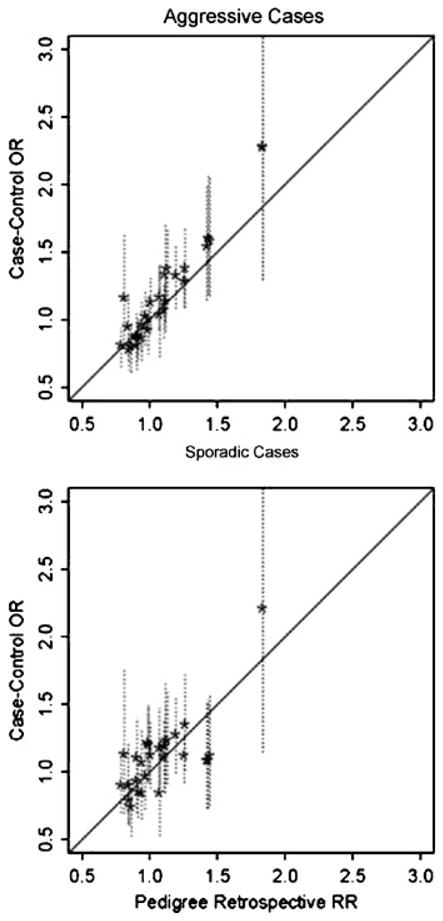
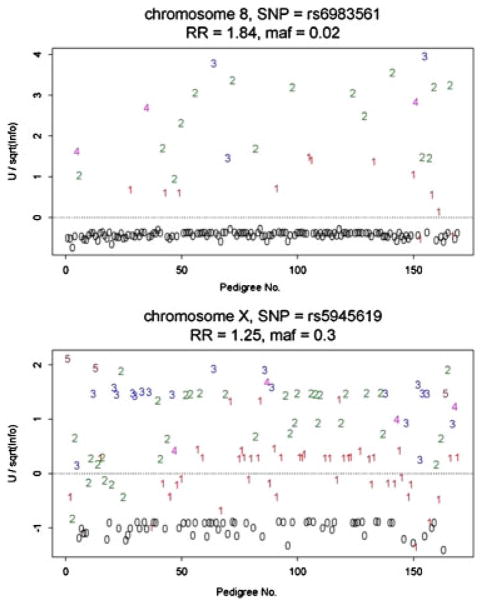
Pedigrees collected for linkage studies are a valuable resource that could be used to estimate genetic relative risks (RRs) for genetic variants recently discovered in case-control genome wide association studies. To estimate RRs from highly ascertained pedigrees, a pedigree "retrospective likelihood" can be used, which adjusts for ascertainment by conditioning on the phenotypes of pedigree members. We explore a variety of approaches to compute the retrospective likelihood, and illustrate a Newton-Raphson method that is computationally efficient particularly for single nucleotide polymorphisms (SNPs) modeled as log-additive effect of alleles on the RR. We also illustrate, by simulations, that a naïve "composite likelihood" method that can lead to biased RR estimates, mainly by not conditioning on the ascertainment process-or as we propose-the disease status of all pedigree members. Applications of the retrospective likelihood to pedigrees collected for a prostate cancer linkage study and recently reported risk-SNPs illustrate the utility of our methods, with results showing that the RRs estimated from the highly ascertained pedigrees are consistent with odds ratios estimated in case-control studies. We also evaluate the potential impact of residual correlations of disease risk among family members due to shared unmeasured risk factors (genetic or environmental) by allowing for a random baseline risk parameter. When modeling only the affected family members in our data, there was little evidence for heterogeneity in baseline risks across families.
(c) 2009 Wiley-Liss, Inc.
Figures
Similar articles
-
Candidate-gene association studies with pedigree data: controlling for environmental covariates.Genet Epidemiol. 2003 May;24(4):273-83. doi: 10.1002/gepi.10228. Genet Epidemiol. 2003. PMID: 12687644
-
Evaluation of linkage and association of HPC2/ELAC2 in patients with familial or sporadic prostate cancer.Am J Hum Genet. 2001 Apr;68(4):901-11. doi: 10.1086/319513. Epub 2001 Mar 14. Am J Hum Genet. 2001. PMID: 11254448 Free PMC article.
-
Estimating penetrance from family data using a retrospective likelihood when ascertainment depends on genotype and age of onset.Genet Epidemiol. 2004 Sep;27(2):109-17. doi: 10.1002/gepi.20007. Genet Epidemiol. 2004. PMID: 15305327
-
Estimating single nucleotide polymorphism associations using pedigree data: applications to breast cancer.Br J Cancer. 2013 Jun 25;108(12):2610-22. doi: 10.1038/bjc.2013.277. Epub 2013 Jun 11. Br J Cancer. 2013. PMID: 23756864 Free PMC article.
-
Sampling correction in linkage analysis.Genet Epidemiol. 2004 Sep;27(2):87-96. doi: 10.1002/gepi.20008. Genet Epidemiol. 2004. PMID: 15305325 Review.
Cited by
-
Efficient generalized least squares method for mixed population and family-based samples in genome-wide association studies.Genet Epidemiol. 2014 Jul;38(5):430-8. doi: 10.1002/gepi.21811. Epub 2014 May 20. Genet Epidemiol. 2014. PMID: 24845555 Free PMC article.
-
An expanded variant list and assembly annotation identifies multiple novel coding and noncoding genes for prostate cancer risk using a normal prostate tissue eQTL data set.PLoS One. 2019 Apr 8;14(4):e0214588. doi: 10.1371/journal.pone.0214588. eCollection 2019. PLoS One. 2019. PMID: 30958860 Free PMC article.
-
Cumulative risks of colorectal cancer in Han Chinese patients with Lynch syndrome in Taiwan.Sci Rep. 2021 Apr 26;11(1):8899. doi: 10.1038/s41598-021-88289-2. Sci Rep. 2021. PMID: 33903664 Free PMC article. Clinical Trial.
-
Multiple genetic variant association testing by collapsing and kernel methods with pedigree or population structured data.Genet Epidemiol. 2013 Jul;37(5):409-18. doi: 10.1002/gepi.21727. Epub 2013 May 5. Genet Epidemiol. 2013. PMID: 23650101 Free PMC article.
-
Network-directed cis-mediator analysis of normal prostate tissue expression profiles reveals downstream regulatory associations of prostate cancer susceptibility loci.Oncotarget. 2017 Sep 8;8(49):85896-85908. doi: 10.18632/oncotarget.20717. eCollection 2017 Oct 17. Oncotarget. 2017. PMID: 29156765 Free PMC article.
References
-
- Carayol J, Bonaiti-Pellie C. Estimating penetrance from family data using a retrospective likelihood when ascertainment depends on genotype and age of onset. Genet Epidemiol. 2004;27:109–117. - PubMed
-
- Chanock SJ, Manolio T, Boehnke M, Boerwinkle E, Hunter DJ, Thomas G, Hirschhorn JN, Abecasis G, Altshuler D, Bailey-Wilson JE, et al. Replicating genotype-phenotype associations. Nature. 2007;447:655–660. - PubMed
-
- Chatterjee N, Wacholder S. A marginal likelihood approach for estimating penetrance from kin-cohort designs. Biometrics. 2001;57:245–252. - PubMed
-
- Chatterjee N, Shih J, Hartge P, Brody L, Tucker M, Wacholder S. Association and aggregation analysis using kin-cohort designs with applications to genotype and family history data from the Washington Ashkenazi Study. Genet Epidemiol. 2001;21:123–138. - PubMed
Publication types
MeSH terms
Grants and funding
LinkOut - more resources
Full Text Sources
Medical
