. 2010 Mar 1;9(2):234-47.
doi: 10.1111/j.1601-183X.2009.00553.x. Epub 2009 Nov 10.

A genome-wide association study identifies multiple loci associated with mathematics ability and disability

Affiliations
Free PMC article

A genome-wide association study identifies multiple loci associated with mathematics ability and disability

S J Docherty et al. Genes Brain Behav. .
Free PMC article

Abstract

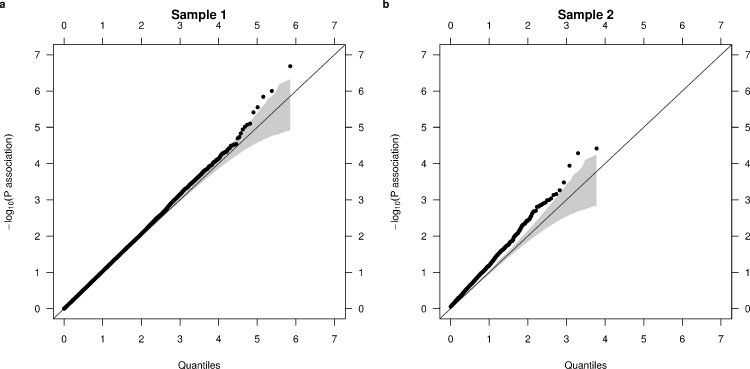
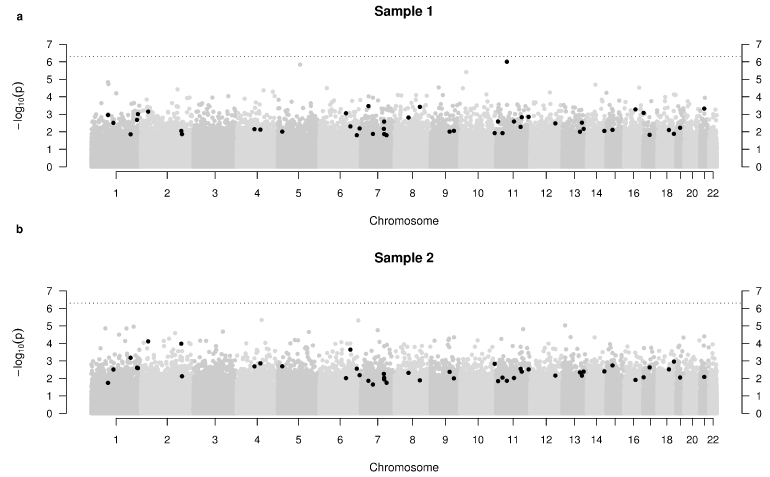
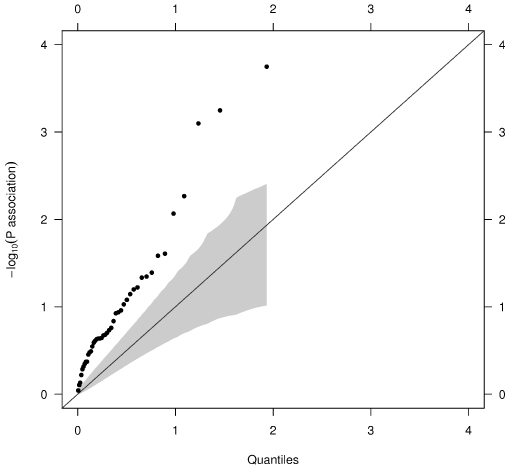
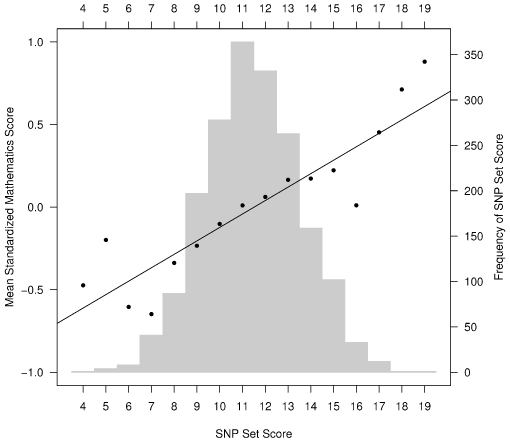
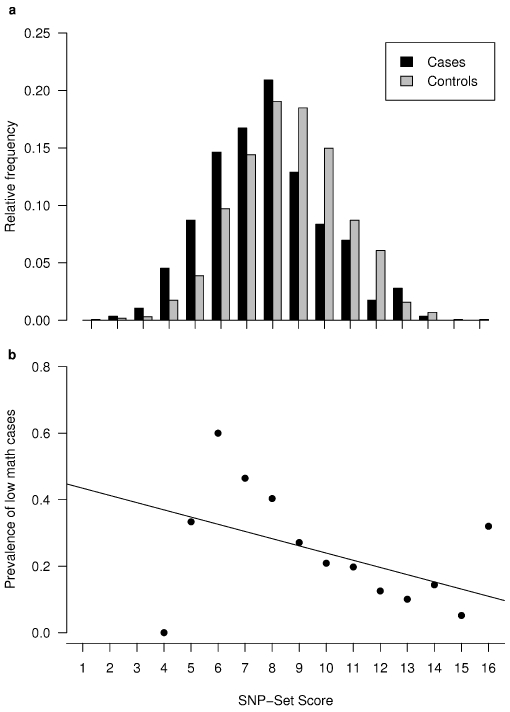
Numeracy is as important as literacy and exhibits a similar frequency of disability. Although its etiology is relatively poorly understood, quantitative genetic research has demonstrated mathematical ability to be moderately heritable. In this first genome-wide association study (GWAS) of mathematical ability and disability, 10 out of 43 single nucleotide polymorphism (SNP) associations nominated from two high- vs. low-ability (n = 600 10-year-olds each) scans of pooled DNA were validated (P < 0.05) in an individually genotyped sample of (*)2356 individuals spanning the entire distribution of mathematical ability, as assessed by teacher reports and online tests. Although the effects are of the modest sizes now expected for complex traits and require further replication, interesting candidate genes are implicated such as NRCAM which encodes a neuronal cell adhesion molecule. When combined into a set, the 10 SNPs account for 2.9% (F = 56.85; df = 1 and 1881; P = 7.277e-14) of the phenotypic variance. The association is linear across the distribution consistent with a quantitative trait locus (QTL) hypothesis; the third of children in our sample who harbour 10 or more of the 20 risk alleles identified are nearly twice as likely (OR = 1.96; df = 1; P = 3.696e-07) to be in the lowest performing 15% of the distribution. Our results correspond with those of quantitative genetic research in indicating that mathematical ability and disability are influenced by many genes generating small effects across the entire spectrum of ability, implying that more highly powered studies will be needed to detect and replicate these QTL associations.


Figures

Figure 1
Figure 1
Q-Q plot for samples 1 and 2. Negative log base 10 P-values from a mixed-effects model likelihood ratio test are plotted against theoretical quantiles from the null distribution. The straight line at x = y represents the null distribution and the grey areas represent 95% bootstrapped confidence intervals on the null. Panel (a) includes all SNPs passing quality control assayed in sample 1 and reveals only slight deviation from chance association; panel (b) displays only the top 3000 SNPs from sample 1 tested in sample 2 (one-tailed). Deviation from expected is greater here, indicating an increase in the presence of true associations.
Figure 2
Figure 2
Whole-genome plots of P -values obtained from samples 1 and 2. Only those SNPs revealing between-group RAS differences in the same direction across both samples are plotted. Of the 3000 SNPs revealing the greatest differences in sample 1, the top-performing 46 in sample 2 were selected for further study. These SNPs are marked in black.
Figure 3
Figure 3
Q-Q plot for mathematics association results of the 43 SNPs individually genotyped in sample 3. Grey region indicates bootstrapped 95% confidence intervals. 10 SNPs reach nominal significance and 3 survive Bonferroni correction for multiple testing. The observed distribution deviates from the expected very early on, suggesting the presence of further associations which might be detected in a sample with more power.
Figure 4
Figure 4
Correlation between SNP-set score and mathematical ability. SNP-set scores were created for individuals in sample 3 by summing performance-increasing allele scores across the 10 associated SNPs identified—rs11225308, rs363449, rs17278234, rs11154532, rs12199332, rs12613365, rs6588923, rs2300052, rs6947045 and rs1215603. Here, average math scores are plotted against SNP-set scores. Grey bar chart demonstrates the number of individuals with each SNP-set score. The graph runs only from 4 to 19 as there were no individuals with SNP-set scores of 0 to 3 or 20. When association between SNP-set score and mathematical performance was tested across all individuals in sample 3 using linear models, the SNP-set was found to account for 2.9% (F = 56.85; d f = 1 and 1881; P = 7.277e–14) of the variance in mathematics score—i.e. a correlation of 0.17.
Figure 5
Figure 5
Relationship of SNP-set score to prevalence ratio of low mathematical performance (defined as the lowest performing 15%). SNP-set scores were gauged by summing the performance-increasing allele scores across the 10 associated SNPs identified—rs11225308, rs363449, rs17278234, rs11154532, rs12199332, rs12613365, rs6588923, rs2300052, rs6947045 and rs1215603. The graph runs only from 4 to 19 as there were no individuals with SNP-set scores of 0 to 3 or 20. Plot displays (a) relative frequencies of SNP-set scores within case (low mathematical performance) and control groups and (b) the relationship of SNP-set score to prevalence of cases of low mathematical performance. Analysis across all individuals in sample 3 revealed the SNP-set to be significantly associated with cases of low mathematical performance (P = 4.18e –09; df = 1881; N = 1883).

References

    1. Alarcón M, DeFries JC, Light JG, Pennington BF. A twin study of mathematics disability. J Learn Disabil. 1997;30:617–623. - PubMed
    1. Alarcón M, Knopik VS, DeFries JC. Covariation of mathematics achievement and general cognitive ability in twins. J Sch Psychol. 2000;38:63–77.
    1. American Psychiatric Association. Diagnostic and Statistical Manual of Mental Disorders. Washington, DC: American Psychiatric Association; 1994.
    1. Balding DJ. A tutorial on statistical methods for population association studies. Nat Rev Genet. 2006;7:781–791. - PubMed
    1. Barratt BJ, Payne F, Rance HE, Nutland S, Todd JA, Clayton DG. Identification of the sources of error in allele frequency estimations from pooled DNA indicates an optimal experimental design. Ann Hum Genet. 2002;66:393–405. - PubMed

Publication types