

Acute metabolic responses to a high-carbohydrate meal in outpatients with type 2 diabetes treated with a low-carbohydrate diet: a crossover meal tolerance study
- PMID: 20040075
- PMCID: PMC2811105
- DOI: 10.1186/1743-7075-6-52
Acute metabolic responses to a high-carbohydrate meal in outpatients with type 2 diabetes treated with a low-carbohydrate diet: a crossover meal tolerance study
Abstract
Background: A low-carbohydrate diet (LCD) achieves good glycemic control in type 2 diabetes (T2DM) compared with a high-carbohydrate diet. With respect to energy metabolism, acute metabolic responses to high-carbohydrate meals (HCMs) have not been determined in LCD patients with T2DM.
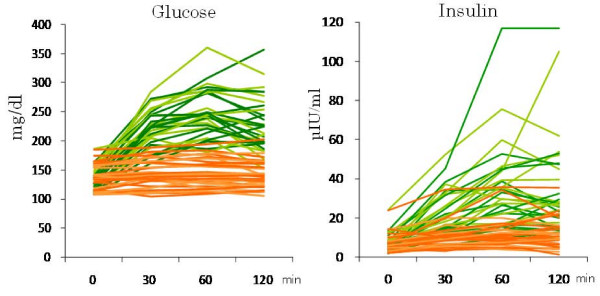
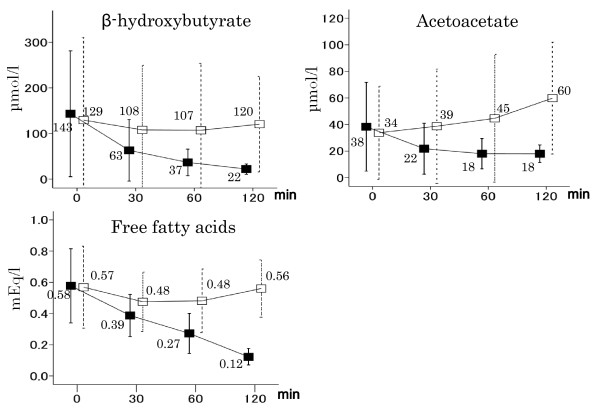
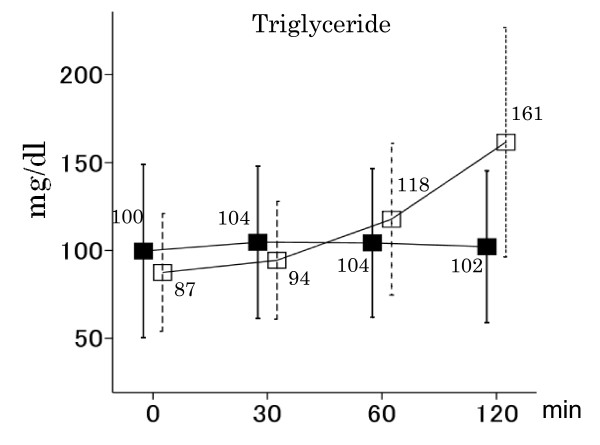
Subjects and methods: We enrolled 31 subjects with T2DM (mean age: 62 yrs, mean hemoglobin A1c level: 6.9%), of whom 13 were on a strict LCD (26% carbohydrate diet), and 18 a moderate one (44% carbohydrate diet). Two isocaloric meals were administered to all subjects in a randomized crossover design. The carbohydrate:protein:fat ratios of HCMs and low-carbohydrate meals (LCMs) were 59:20:21 and 7:20:73, respectively. Serum beta-hydroxybutyrate, acetoacetate, free fatty acids (FFAs), triglyceride and insulin, and plasma glucose concentrations were measured for 120 minutes after the intake of each meal.
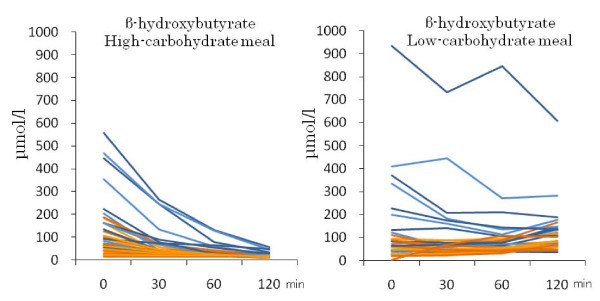
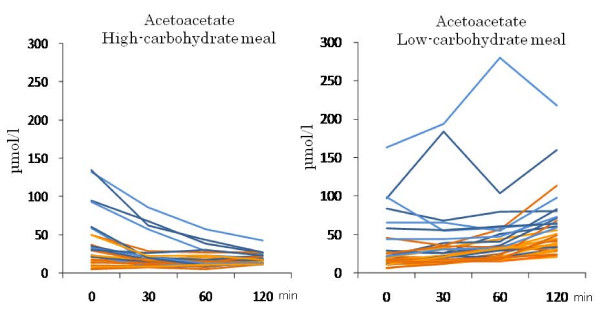
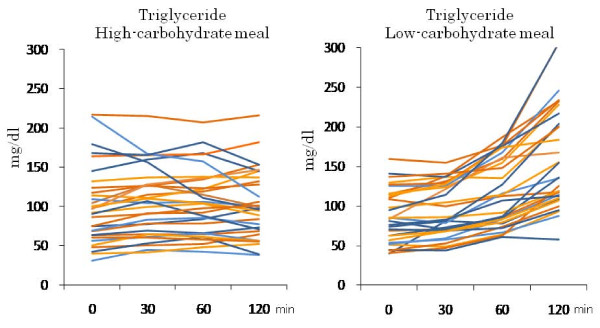
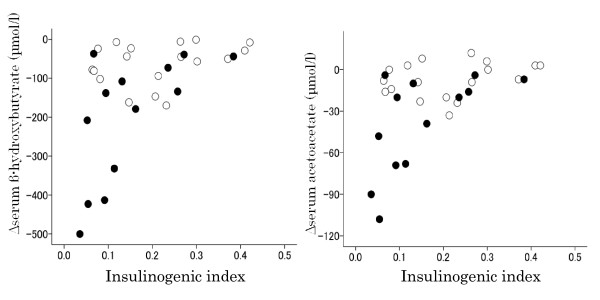
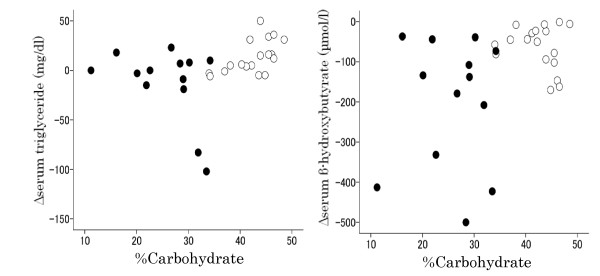
Results: HCMs rapidly decreased postprandial beta-hydroxybutyrate, acetoacetate and FFA concentrations within 2 hours in all patients in combination with rapid increases in serum insulin and plasma glucose, while LCMs increased or did not change beta-hydroxybutyrate, acetoacetate and FFAs (P < 0.001 for all). HCMs did not change postprandial triglyceride concentrations over 2 hours, while LCMs gradually increased them (P < 0.001). HCMs sharply and rapidly decreased postprandial beta-hydroxybutyrate and acetoacetate concentrations in strict LCD subjects over 2 hours, but only slightly decreased them in moderate LCD subjects (P < 0.001, difference between strict and moderate LCD subjects). The parameter Deltaketone bodies (level at 120 minutes - level at baseline) was significantly correlated with the insulinogenic index (Spearman's r = 0.503 for beta-hydroxybutyrate and 0.509 for acetoacetate), but not with total insulin secretory capacity. Moreover, HCMs slightly decreased postprandial triglyceride levels in strict LCD subjects but somewhat increased them in the moderate LCD subjects (P = 0.002). The parameter Deltatriglyceride was significantly correlated with background dietary %carbohydrate (Spearman's r = 0.484).
Conclusion: HCMs rapidly decreased postprandial ketone body concentrations in T2DM patients treated with a LCD. The decreases were more remarkable in strict than in moderate LCD subjects. HCMs slightly decreased postprandial triglyceride levels in strict LCD subjects. The parameter Deltaketone bodies was significantly correlated with the insulinogenic index, as was Deltatriglyceride with background dietary %carbohydrate.
Figures
Similar articles
-
Third Exposure to a Reduced Carbohydrate Meal Lowers Evening Postprandial Insulin and GIP Responses and HOMA-IR Estimate of Insulin Resistance.PLoS One. 2016 Oct 31;11(10):e0165378. doi: 10.1371/journal.pone.0165378. eCollection 2016. PLoS One. 2016. PMID: 27798656 Free PMC article. Clinical Trial.
-
Long-term effect of varying the source or amount of dietary carbohydrate on postprandial plasma glucose, insulin, triacylglycerol, and free fatty acid concentrations in subjects with impaired glucose tolerance.Am J Clin Nutr. 2003 Mar;77(3):612-21. doi: 10.1093/ajcn/77.3.612. Am J Clin Nutr. 2003. PMID: 12600851 Clinical Trial.
-
Effects of breakfast meal composition on second meal metabolic responses in adults with Type 2 diabetes mellitus.Eur J Clin Nutr. 2006 Sep;60(9):1122-9. doi: 10.1038/sj.ejcn.1602427. Epub 2006 May 3. Eur J Clin Nutr. 2006. PMID: 16670695 Clinical Trial.
-
Alterations in Plasma Triglyceride Concentrations Following Two Oral Meals with Different Fat Content in Patients with Type 2 Diabetes Mellitus.Curr Vasc Pharmacol. 2018;16(4):385-392. doi: 10.2174/1570161115666170529084621. Curr Vasc Pharmacol. 2018. PMID: 28552072
-
The acute effects of dietary carbohydrate reduction on postprandial responses of non-esterified fatty acids and triglycerides: a randomized trial.Lipids Health Dis. 2018 Dec 27;17(1):295. doi: 10.1186/s12944-018-0953-8. Lipids Health Dis. 2018. PMID: 30591062 Free PMC article. Clinical Trial.
Cited by
-
The impact of carbohydrate intake and its sources on hemoglobin A1c levels in Japanese patients with type 2 diabetes not taking anti-diabetic medication.Diabetes Metab Syndr Obes. 2018 Mar 9;11:53-64. doi: 10.2147/DMSO.S154839. eCollection 2018. Diabetes Metab Syndr Obes. 2018. PMID: 29563823 Free PMC article.
-
Comparison of Body Mass Index, Energy and Macronutrient Intake, and Dietary Inflammatory Index Between Type 2 Diabetic and Healthy Individuals.J Res Health Sci. 2025 Jan 1;25(1):e00639. doi: 10.34172/jrhs.2025.174. Epub 2024 Dec 25. J Res Health Sci. 2025. PMID: 39996348 Free PMC article.
-
The Role of Glucagon-Like Peptide-1 Receptor Agonists in Type 2 Diabetes: Understanding How Data Can Inform Clinical Practice in Korea.Diabetes Metab J. 2015 Jun;39(3):177-87. doi: 10.4093/dmj.2015.39.3.177. Diabetes Metab J. 2015. PMID: 26124987 Free PMC article. Review.
-
Effects of R219K polymorphism of ATP-binding cassette transporter 1 gene on serum lipids ratios induced by a high-carbohydrate and low-fat diet in healthy youth.Biol Res. 2014 Mar 26;47(1):4. doi: 10.1186/0717-6287-47-4. Biol Res. 2014. PMID: 25027185 Free PMC article.
-
Elevated proinflammatory cytokine production by a skewed T cell compartment requires monocytes and promotes inflammation in type 2 diabetes.J Immunol. 2011 Jan 15;186(2):1162-72. doi: 10.4049/jimmunol.1002615. Epub 2010 Dec 17. J Immunol. 2011. PMID: 21169542 Free PMC article.
References
-
- Accurso A, Bernstein RK, Dahlqvist A, Draznin B, Feinman RD, Fine EJ, Gleed A, Jacobs DB, Larson G, Lustig RH, Manninen AH, McFarlane SI, Morrison K, Nielsen JV, Ravnskov U, Roth KS, Silvestre R, Sowers JR, Sundberg R, Volek JS, Westman EC, Wood RJ, Wortman J, Vernon MC. Dietary carbohydrate restriction in type 2 diabetes mellitus and metabolic syndrome: time for a critical appraisal. Nutr Metab (Lond) 2008;5:9. doi: 10.1186/1743-7075-5-9. - DOI - PMC - PubMed
LinkOut - more resources
Full Text Sources
