

A white-box approach to microarray probe response characterization: the BaFL pipeline
- PMID: 20040098
- PMCID: PMC2804686
- DOI: 10.1186/1471-2105-10-449
A white-box approach to microarray probe response characterization: the BaFL pipeline
Abstract
Background: Microarrays depend on appropriate probe design to deliver the promise of accurate genome-wide measurement. Probe design, ideally, produces a unique probe-target match with homogeneous duplex stability over the complete set of probes. Much of microarray pre-processing is concerned with adjusting for non-ideal probes that do not report target concentration accurately. Cross-hybridizing probes (non-unique), probe composition and structure, as well as platform effects such as instrument limitations, have been shown to affect the interpretation of signal. Data cleansing pipelines seldom filter specifically for these constraints, relying instead on general statistical tests to remove the most variable probes from the samples in a study. This adjusts probes contributing to ProbeSet (gene) values in a study-specific manner. We refer to the complete set of factors as biologically applied filter levels (BaFL) and have assembled an analysis pipeline for managing them consistently. The pipeline and associated experiments reported here examine the outcome of comprehensively excluding probes affected by known factors on inter-experiment target behavior consistency.
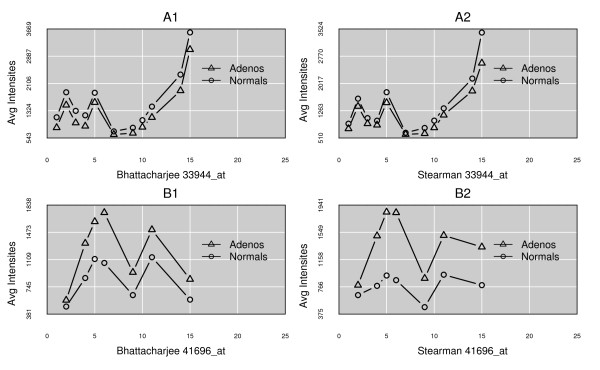
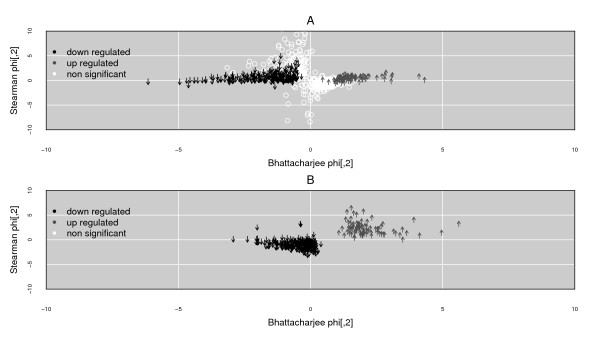
Results: We present here a 'white box' probe filtering and intensity transformation protocol that incorporates currently understood factors affecting probe and target interactions; the method has been tested on data from the Affymetrix human GeneChip HG-U95Av2, using two independent datasets from studies of a complex lung adenocarcinoma phenotype. The protocol incorporates probe-specific effects from SNPs, cross-hybridization and low heteroduplex affinity, as well as effects from scanner sensitivity, sample batches, and includes simple statistical tests for identifying unresolved biological factors leading to sample variability. Subsequent to filtering for these factors, the consistency and reliability of the remaining measurements is shown to be markedly improved.
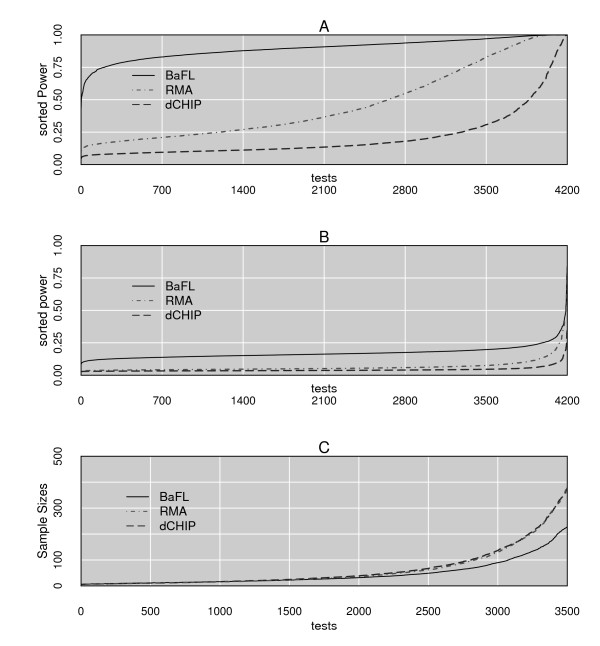
Conclusions: The data cleansing protocol yields reproducible estimates of a given probe or ProbeSet's (gene's) relative expression that translates across datasets, allowing for credible cross-experiment comparisons. We provide supporting evidence for the validity of removing several large classes of probes, and for our approaches for removing outlying samples. The resulting expression profiles demonstrate consistency across the two independent datasets. Finally, we demonstrate that, given an appropriate sampling pool, the method enhances the t-test's statistical power to discriminate significantly different means over sample classes.
Figures
Similar articles
-
The LO-BaFL method and ALS microarray expression analysis.BMC Bioinformatics. 2012 Sep 24;13:244. doi: 10.1186/1471-2105-13-244. BMC Bioinformatics. 2012. PMID: 23006766 Free PMC article.
-
AffyMAPSDetector: a software tool to characterize Affymetrix GeneChip expression arrays with respect to SNPs.BMC Bioinformatics. 2007 Jul 30;8:276. doi: 10.1186/1471-2105-8-276. BMC Bioinformatics. 2007. PMID: 17663786 Free PMC article.
-
Interactively optimizing signal-to-noise ratios in expression profiling: project-specific algorithm selection and detection p-value weighting in Affymetrix microarrays.Bioinformatics. 2004 Nov 1;20(16):2534-44. doi: 10.1093/bioinformatics/bth280. Epub 2004 Apr 29. Bioinformatics. 2004. PMID: 15117752
-
Redefinition of Affymetrix probe sets by sequence overlap with cDNA microarray probes reduces cross-platform inconsistencies in cancer-associated gene expression measurements.BMC Bioinformatics. 2005 Apr 25;6:107. doi: 10.1186/1471-2105-6-107. BMC Bioinformatics. 2005. PMID: 15850491 Free PMC article.
-
Microarray oligonucleotide probes.Methods Enzymol. 2006;410:73-98. doi: 10.1016/S0076-6879(06)10004-X. Methods Enzymol. 2006. PMID: 16938547 Review.
Cited by
-
ArrayInitiative - a tool that simplifies creating custom Affymetrix CDFs.BMC Bioinformatics. 2011 May 6;12:136. doi: 10.1186/1471-2105-12-136. BMC Bioinformatics. 2011. PMID: 21548938 Free PMC article.
-
The LO-BaFL method and ALS microarray expression analysis.BMC Bioinformatics. 2012 Sep 24;13:244. doi: 10.1186/1471-2105-13-244. BMC Bioinformatics. 2012. PMID: 23006766 Free PMC article.
-
AnyExpress: integrated toolkit for analysis of cross-platform gene expression data using a fast interval matching algorithm.BMC Bioinformatics. 2011 Mar 17;12:75. doi: 10.1186/1471-2105-12-75. BMC Bioinformatics. 2011. PMID: 21410990 Free PMC article.
References
-
- Fridlyand SDaJ. In: DNA Arrays Methods and Protocols. Rampal JB, editor. Vol. 170. Totoja, NJ: Humana Press; Introduction to Classification in Microarray Experiments; pp. 132–149.
-
- Parmigiani ESGG, Irizarry RA, Zeger SL. The Analysis of Gene Expression Data. New York: Springer; 2003.
-
- Southern EM. DNA microarrays. History and overview. Methods Mol Biol. 2001;170:1–15. - PubMed
MeSH terms
LinkOut - more resources
Full Text Sources
